

ACVR1C/SMAD2 signaling promotes invasion and growth in retinoblastoma
- PMID: 30401983
- PMCID: PMC6430693
- DOI: 10.1038/s41388-018-0543-2
ACVR1C/SMAD2 signaling promotes invasion and growth in retinoblastoma
Abstract
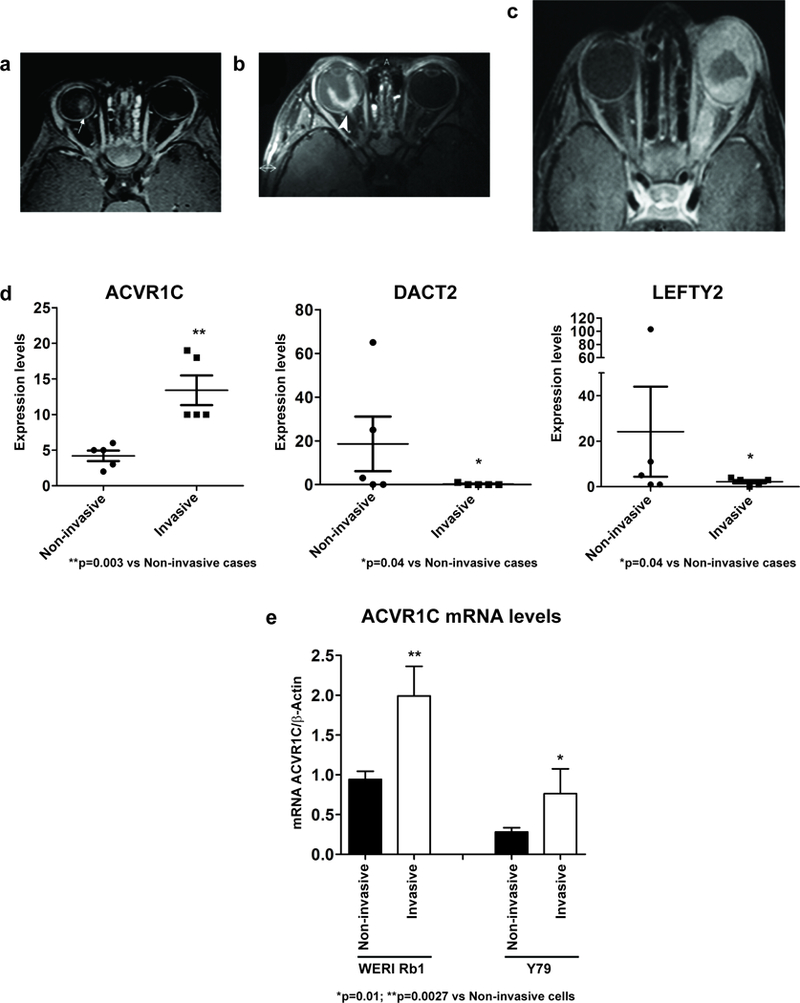
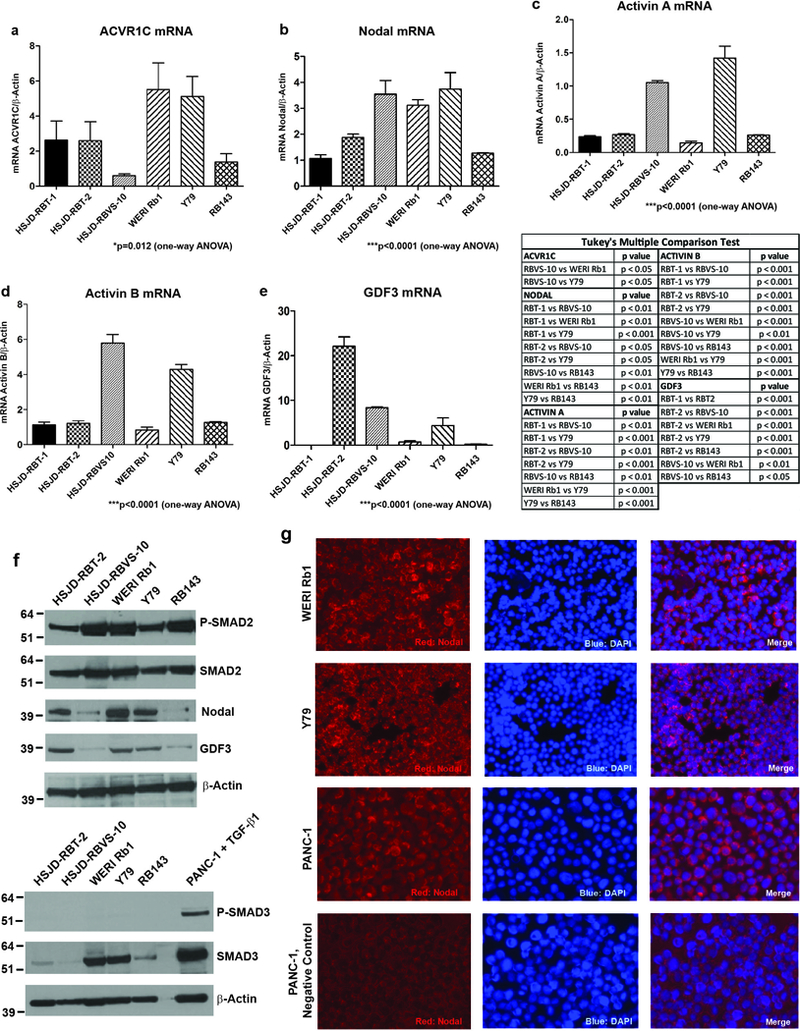
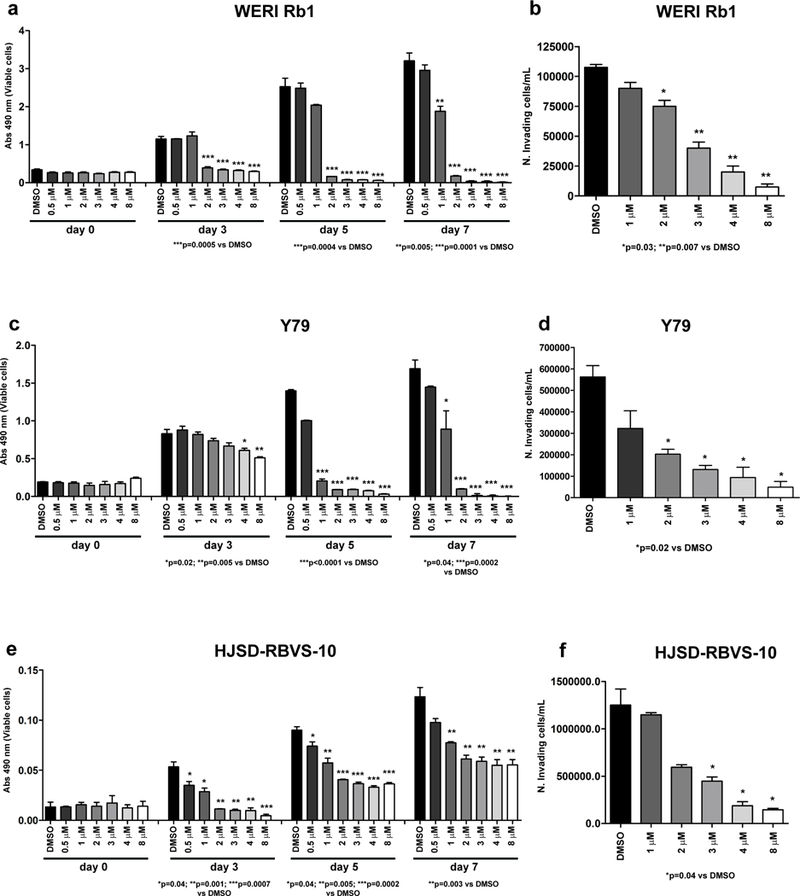
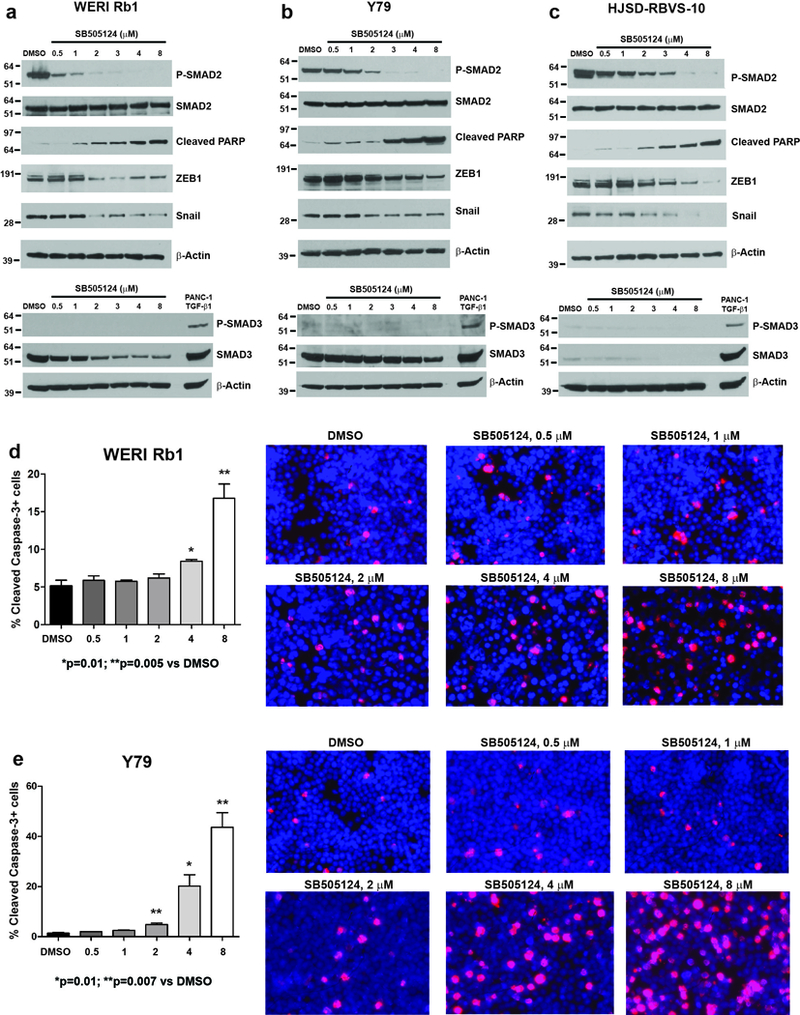
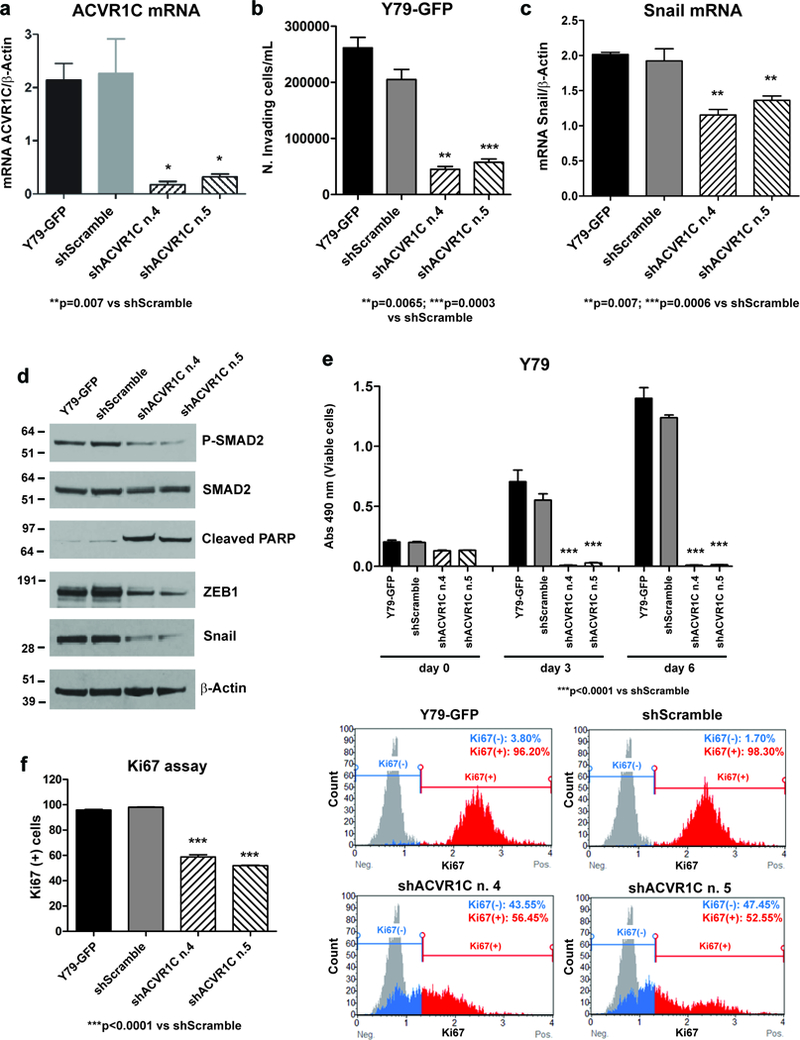
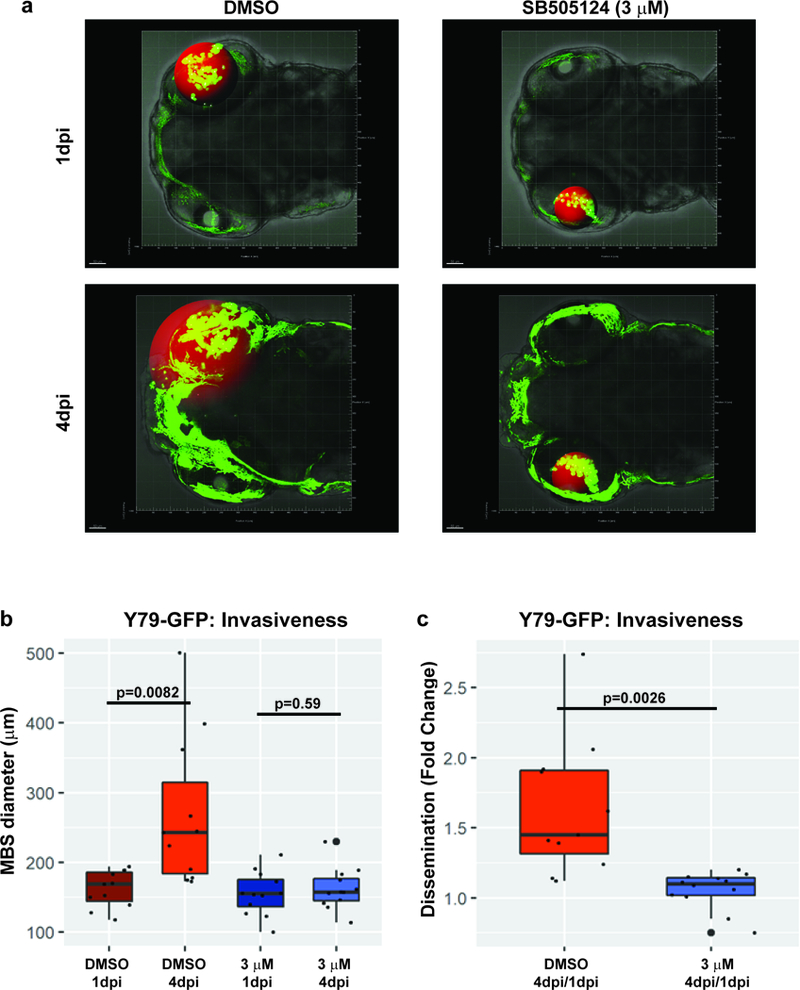
Retinoblastoma is the most common intraocular cancer in children. While the primary tumor can often be treated by local or systemic chemotherapy, metastatic dissemination is generally resistant to therapy and remains a leading cause of pediatric cancer death in much of the world. In order to identify new therapeutic targets in aggressive tumors, we sequenced RNA transcripts in five snap frozen retinoblastomas which invaded the optic nerve and five which did not. A three-fold increase was noted in mRNA levels of ACVR1C/ALK7, a type I receptor of the TGF-β family, in invasive retinoblastomas, while downregulation of DACT2 and LEFTY2, negative modulators of the ACVR1C signaling, was observed in most invasive tumors. A two- to three-fold increase in ACVR1C mRNA was also found in invasive WERI Rb1 and Y79 cells as compared to non-invasive cells in vitro. Transcripts of ACVR1C receptor and its ligands (Nodal, Activin A/B, and GDF3) were expressed in six retinoblastoma lines, and evidence of downstream SMAD2 signaling was present in all these lines. Pharmacological inhibition of ACVR1C signaling using SB505124, or genetic downregulation of the receptor using shRNA potently suppressed invasion, growth, survival, and reduced the protein levels of the mesenchymal markers ZEB1 and Snail. The inhibitory effects on invasion, growth, and proliferation were recapitulated by knocking down SMAD2, but not SMAD3. Finally, in an orthotopic zebrafish model of retinoblastoma, a 55% decrease in tumor spread was noted (p = 0.0026) when larvae were treated with 3 µM of SB505124, as compared to DMSO. Similarly, knockdown of ACVR1C in injected tumor cells using shRNA also resulted in a 54% reduction in tumor dissemination in the zebrafish eye as compared to scrambled shRNA control (p = 0.0005). Our data support a role for the ACVR1C/SMAD2 pathway in promoting invasion and growth of retinoblastoma.
Conflict of interest statement
Disclosure/Conflict of Interest: The Authors declare no conflict of interest.
Figures
Similar articles
-
Downregulation of Nodal inhibits metastatic progression in retinoblastoma.Acta Neuropathol Commun. 2019 Aug 26;7(1):137. doi: 10.1186/s40478-019-0785-4. Acta Neuropathol Commun. 2019. PMID: 31451106 Free PMC article.
-
UV-Induced Reduction of ACVR1C Decreases SREBP1 and ACC Expression by the Suppression of SMAD2 Phosphorylation in Normal Human Epidermal Keratinocytes.Int J Mol Sci. 2021 Jan 22;22(3):1101. doi: 10.3390/ijms22031101. Int J Mol Sci. 2021. PMID: 33499275 Free PMC article.
-
Activin stimulates CYP19A gene expression in human ovarian granulosa cell-like KGN cells via the Smad2 signaling pathway.Biochem Biophys Res Commun. 2013 Jul 5;436(3):443-8. doi: 10.1016/j.bbrc.2013.05.124. Epub 2013 Jun 6. Biochem Biophys Res Commun. 2013. PMID: 23747729
-
ALK7 Signaling Manifests a Homeostatic Tissue Barrier That Is Abrogated during Tumorigenesis and Metastasis.Dev Cell. 2019 May 6;49(3):409-424.e6. doi: 10.1016/j.devcel.2019.04.015. Dev Cell. 2019. PMID: 31063757
-
Regulation of metabolic homeostasis by the TGF-β superfamily receptor ALK7.FEBS J. 2022 Oct;289(19):5776-5797. doi: 10.1111/febs.16090. Epub 2021 Jul 11. FEBS J. 2022. PMID: 34173336 Review.
Cited by
-
Dinutuximab Synergistically Enhances the Cytotoxicity of Natural Killer Cells to Retinoblastoma Through the Perforin-Granzyme B Pathway.Onco Targets Ther. 2020 May 8;13:3903-3920. doi: 10.2147/OTT.S228532. eCollection 2020. Onco Targets Ther. 2020. PMID: 32440155 Free PMC article.
-
Circular RNA ZNF800 (hsa_circ_0082096) regulates cancer stem cell properties and tumor growth in colorectal cancer.BMC Cancer. 2023 Nov 10;23(1):1088. doi: 10.1186/s12885-023-11571-1. BMC Cancer. 2023. PMID: 37950151 Free PMC article.
-
Modeling Cancer Using Zebrafish Xenografts: Drawbacks for Mimicking the Human Microenvironment.Cells. 2020 Aug 27;9(9):1978. doi: 10.3390/cells9091978. Cells. 2020. PMID: 32867288 Free PMC article. Review.
-
Role of non-coding RNAs and exosomal non-coding RNAs in retinoblastoma progression.Front Cell Dev Biol. 2022 Dec 23;10:1065837. doi: 10.3389/fcell.2022.1065837. eCollection 2022. Front Cell Dev Biol. 2022. PMID: 36619866 Free PMC article. Review.
-
tRNA‑derived small RNAs: A novel class of small RNAs in human hypertrophic scar fibroblasts.Int J Mol Med. 2020 Jan;45(1):115-130. doi: 10.3892/ijmm.2019.4411. Epub 2019 Nov 25. Int J Mol Med. 2020. PMID: 31939611 Free PMC article.
References
-
- Honavar SG, Singh AD. Management of advanced retinoblastoma. Ophthalmol Clin North Am 2005; 18: 65–73. - PubMed
-
- Chantada GL, Qaddoumi I, Canturk S, Khetan V, Ma Z, Kimani K, et al. Strategies to manage retinoblastoma in developing countries. Pediatr Blood Cancer 2011; 56: 341–348. - PubMed
-
- Villegas VM, Hess DJ, Wildner A, Gold AS, Murray TG. Retinoblastoma. Curr Opin Ophthalmol 2013; 24: 581–588. - PubMed
-
- Bondestam J, Huotari MA, Morén A, Ustinov J, Kaivo-Oja N, Kallio J, et al. cDNA cloning, expression studies and chromosome mapping of human type I serine/threonine kinase receptor ALK7 (ACVR1C). Cytogenet Cell Genet 2001; 95: 157–62. - PubMed
-
- Shi Y, Massagué J. Mechanisms of TGF-beta signaling from cell membrane to the nucleus.Cell 2003; 113: 685–700. - PubMed
Publication types
MeSH terms
Substances
Grants and funding
LinkOut - more resources
Full Text Sources
Molecular Biology Databases
Research Materials
Miscellaneous
