. 2018 Nov 6;9(1):4635.
doi: 10.1038/s41467-018-07035-x.

Structural basis of Gip1 for cytosolic sequestration of G protein in wide-range chemotaxis

Affiliations

Structural basis of Gip1 for cytosolic sequestration of G protein in wide-range chemotaxis

Takero Miyagawa et al. Nat Commun. .

Abstract

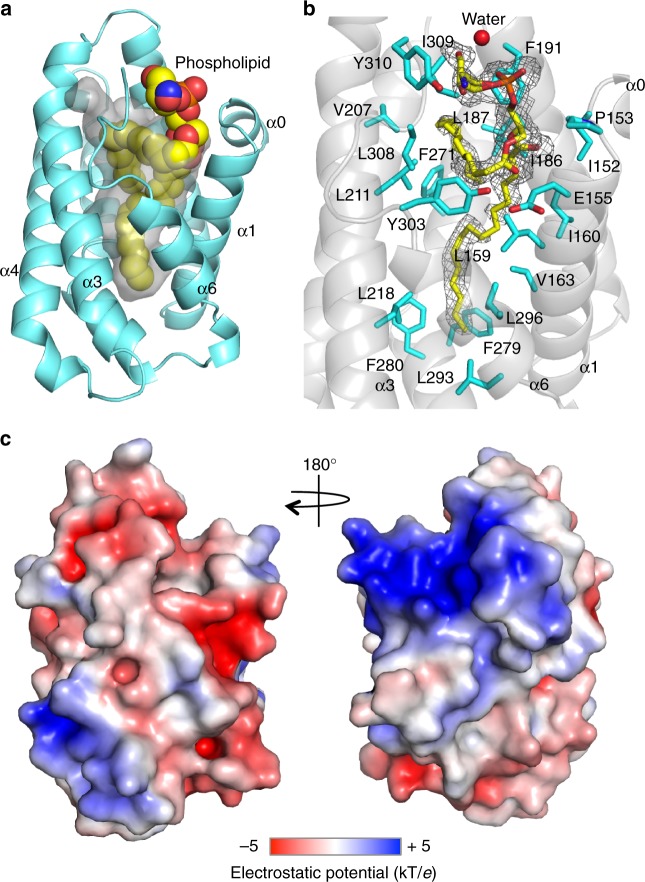
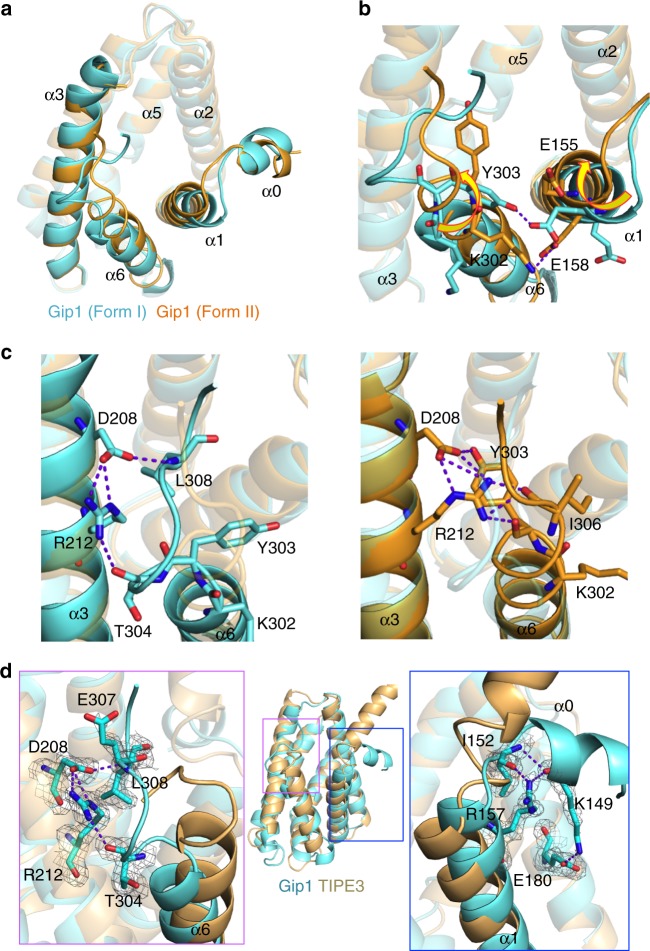
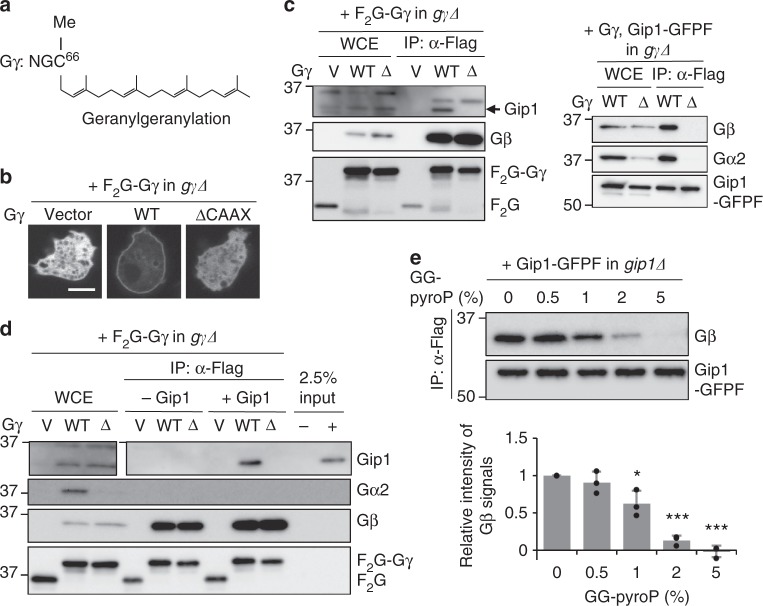
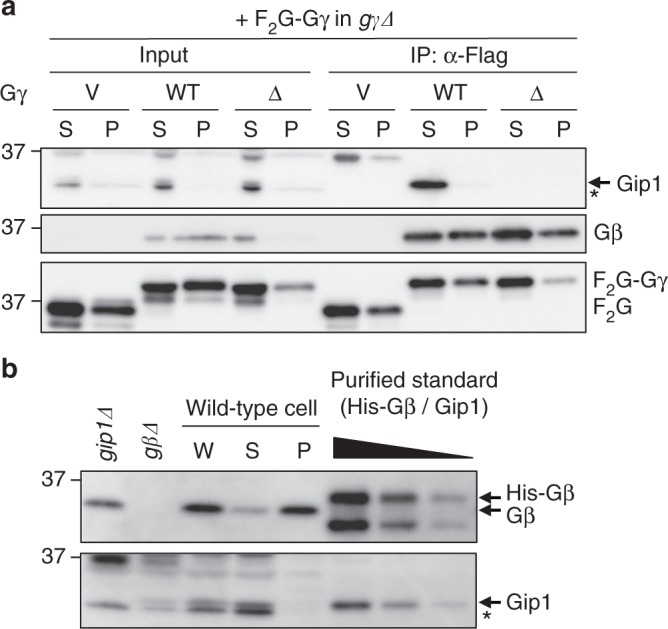
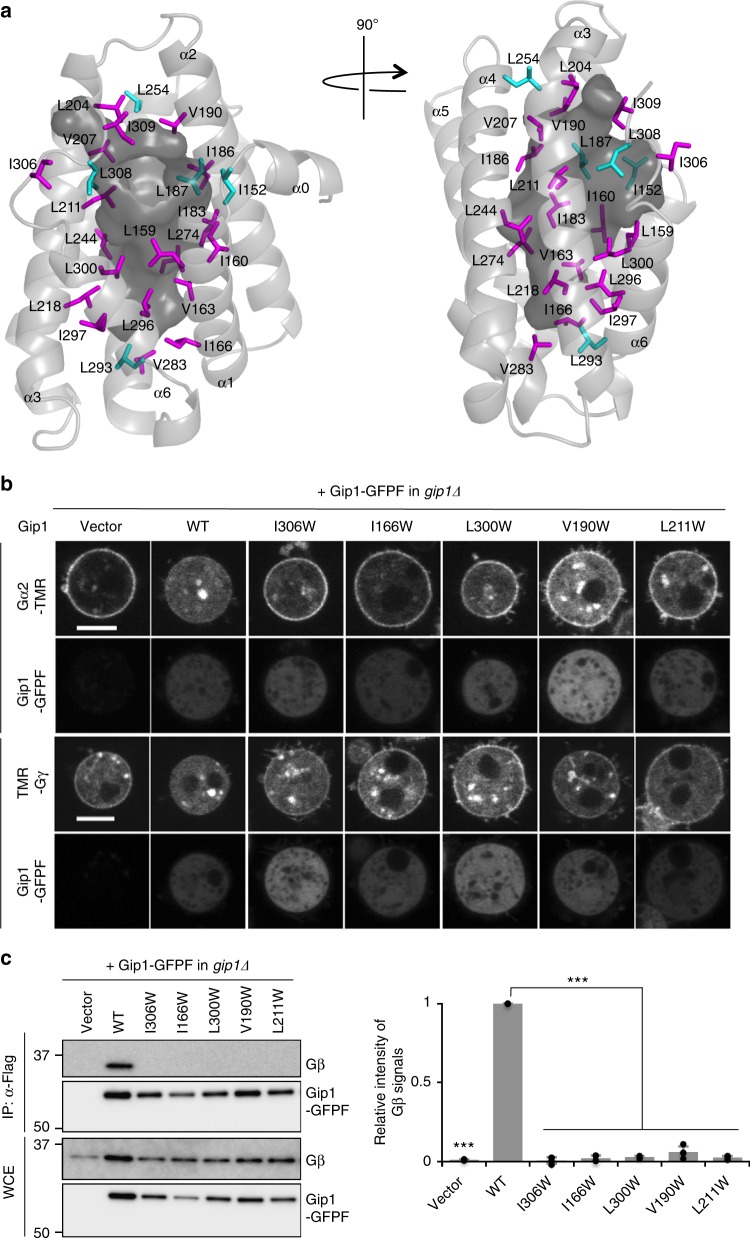
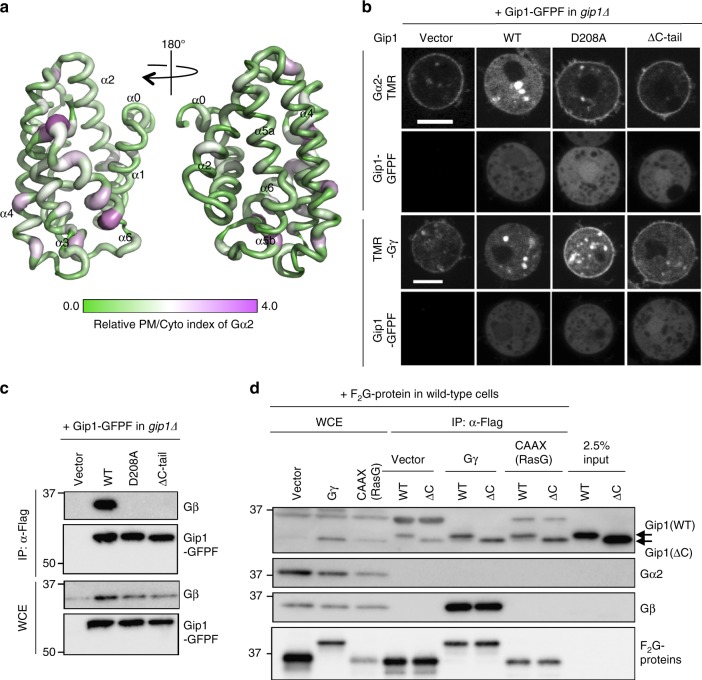
G protein interacting protein 1 (Gip1) binds and sequesters heterotrimeric G proteins in the cytosolic pool, thus regulating G protein-coupled receptor (GPCR) signalling for eukaryotic chemotaxis. Here, we report the underlying structural basis of Gip1 function. The crystal structure reveals that the region of Gip1 that binds to the G protein has a cylinder-like fold with a central hydrophobic cavity composed of six α-helices. Mutagenesis and biochemical analyses indicate that the hydrophobic cavity and the hydrogen bond network at the entrance of the cavity are essential for complex formation with the geranylgeranyl modification on the Gγ subunit. Mutations of the cavity impair G protein sequestration and translocation to the membrane from the cytosol upon receptor stimulation, leading to defects in chemotaxis at higher chemoattractant concentrations. These results demonstrate that the Gip1-dependent regulation of G protein shuttling ensures wide-range gradient sensing in eukaryotic chemotaxis.


Conflict of interest statement

The authors declare no competing interests.

Figures

Fig. 1
Fig. 1
Crystal structure of the G protein-binding domain of Gip1. a Overall structure of Gip1(146–310) and a phospholipid represented by a cartoon and ball model. The surface of the cavity is shown in grey. b Residues and water within van der Waals distance from the phospholipid. The phospholipid is shown with the 2mFo-DFc electron density map contoured at 1.0σ. The water is shown as a red ball. c Electrostatic potential at the molecular surface of Gip1(146–310), ranging from blue (+5 kT/e) to red (−5 kT/e)
Fig. 2
Fig. 2
Structural comparison of two forms of Gip1 and of Gip1 and human TIPE3. a Comparison of two crystal structures of Gip1(146–310). Two forms of Gip1 (Form I in cyan and Form II in light orange) are superimposed. b Rotational movement at α1 and α6. The movement reconstructs a hydrogen bond between α1 and α6. Hydrogen bonds are shown as dashed lines. c Reconstruction of the hydrogen bonding network at α3 and α6. Structural change induces the reconstruction of the hydrogen bonding network, including Asp208 and Arg212. Hydrogen bonds are shown as dashed lines. d Structural comparison of Gip1(146–310) in cyan and TIPE3 (PDB 4Q9V) in pale orange by superimposition. Hydrogen-bonded residues of Gip1 are shown as stick models with the 2mFo-DFc electron density map contoured at 1.0σ. Hydrogen bonds are shown as dashed lines
Fig. 3
Fig. 3
Recognition of the prenyl group on Gγ by the hydrophobic cavity of Gip1. a Schematic diagram of Gγ modification. C-terminal cysteine (C66) is geranylgeranylated and methylated (Me). b Subcellular localization of Gγ in a living cell. Flag-Flag-GFP (F2G) tag alone (vector) or F2G-tagged Gγ(WT) or Gγ(ΔCAAX) in gγΔ cells. Scale bar, 5 μm. c Co-immunoprecipitation of Gγ or Gip1. F2G-Gγ(WT) or F2G-Gγ(ΔCAAX) was expressed in gγΔ cells (left). GFP-Flag-tagged Gip1 (Gip1-GFPF) was coexpressed with Gγ(WT) or Gγ(ΔCAAX) in gγΔ cells (right). Pull-down samples of Gγ (left) and Gip1 (right) were immunoblotted with the indicated antibodies. d In vitro interaction between Gβγ and purified Gip1. Gβγ subunits were bound to beads and incubated with purified full-length Gip1. e Competitive dissociation of G proteins from Gip1 by geranylgeranyl pyrophosphate (GG-pyroP). The data were normalized relative to the band intensities without GG-pyroP and presented as the mean ± SD of three independent experiments (n = 3, *P < 0.05, ***P < 0.001 versus 0% GG-pyroP, two-tailed unpaired Student’s t-test)
Fig. 4
Fig. 4
Subcellular localization of endogenous Gip1 and Gβ. a Preferential complex formation between G proteins and Gip1. Cells were fractionated, and each fraction was used for the IP of F2G or F2G-tagged Gγ. The indicated proteins were visualized by immunoblotting using anti-Gip1, Gβ, and Flag antibodies. b The amount of endogenous Gβ and Gip1. Cells were fractionated to obtain whole-cell extract (W), supernatant (S), and precipitant (P), and their containing proteins were estimated in comparison to purified protein standards. The bands indicated by arrows represent His-Gβ, Gβ, and Gip1. Bands with an asterisk denote nonspecific bands
Fig. 5
Fig. 5
Tryptophan mutagenesis to induce steric blockade in the cavity. a Representation of tryptophan-mutated residues. Mutated residues are shown as stick models. Magenta and cyan colours show the residues that lead to cytosolic Gα reduced and the residues with no effects, respectively. The surface of the cavity is coloured dark grey. b Subcellular localization of Gα2 and Gγ labelled with TMR and Gip1-GFPF in a living cell in the presence of LatA. Representative images of the top 25% of severely impaired mutants are shown. Scale bar, 5 μm. c Co-immunoprecipitation of Gip1 with Gβγ. The same mutants shown in b were analysed. The data were normalized relative to the band intensities of wild-type Gip1 and are presented as the mean ± SD of at least three independent experiments (n = 5 (Vector, WT), 4 (I306W, I166W, V190W), and 3 (L300W, L211W), ***P < 0.001 versus wild-type, two-tailed unpaired Student’s t-test)
Fig. 6
Fig. 6
Comprehensive alanine mutagenesis scan of Gip1(146–310). a Structural mapping of the alanine mutagenesis scan of Gip1(146–310). Relative plasma membrane (PM)/cytosol (Cyto) indexes were normalized by the wild-type value and mapped onto the structure. The values range from purple (strong) to green (weak), represented by both the colour and the thickness of the ribbon diagram. b Subcellular localization of Gα2 and Gγ labelled with TMR and Gip1-GFPF in the presence of LatA. ΔC-tail, deletion of a.a. 304–310 of Gip1. Scale bar, 5 μm. c Co-immunoprecipitation of Gip1 with Gβγ. d In vitro interactions of purified Gip1. Flag-tagged GFP (F2G) as a vector (V), F2G-Gβγ, and F2G containing the CAAX box (a.a. 178–189) from RasG were bound to beads and incubated with purified full-length Gip1 (WT) or C terminus-deleted Gip1, a.a. 1–303 (ΔC)
Fig. 7
Fig. 7
Contribution of Gip1–G protein complex formation to wide-range chemotaxis. a Chemotaxis of gip1Δ cells expressing Gip1 mutants. Cells (green) moved towards the tip of a micropipette filled with 100 μM cAMP. Representative images with cell trajectories (magenta lines) are shown before (0′) and 120 min after (120′) the start of the assay (see Supplementary Movies 3–6). Scale bar, 50 μm. b Chemotactic index (top) and motility speed (bottom) calculated from the assay in a. The magenta lines represent the mean (n = 285–1737 data points from at least 103 cells). Vector, WT, D208A, and ΔC-tail are shown in black, grey, red, and blue, respectively. c Chemotactic response to various cAMP concentrations. The data represent the mean ± SEM of three independent experiments. Vector, WT, D208A, and ΔC-tail are shown by the black-filled diamond, grey-filled circle, red-filled triangle, and blue-filled square, respectively. d Gα2 translocation upon cAMP stimulation in the presence of LatA. Images are from before (−cAMP) and after (+cAMP) 10 μM cAMP application. Scale bar, 5 μm. e Dose dependency of Gα2 translocation in response to different cAMP concentrations. The data represent the mean ± SD (n ≥ 60 cells). Vector, WT, D208A, and ΔC-tail are shown by the black-open diamond, grey-open circle, red-open triangle, and blue-open square, respectively

Similar articles

Cited by

References

    1. Pierce KL, Premont RT, Lefkowitz RJ. Seven-transmembrane receptors. Nat. Rev. Mol. Cell Biol. 2002;3:639–650. doi: 10.1038/nrm908. - DOI - PubMed
    1. Wettschureck N, Offermanns S. Mammalian G proteins and their cell type specific functions. Physiol. Rev. 2005;85:1159–1204. doi: 10.1152/physrev.00003.2005. - DOI - PubMed
    1. Kamp M, Liu Y, Kortholt A. Function and regulation of heterotrimeric G proteins during chemotaxis. Int. J. Mol. Sci. 2016;17:E90. doi: 10.3390/ijms17010090. - DOI - PMC - PubMed
    1. Gilman AG. G proteins: transducers of receptor-generated signals. Annu. Rev. Biochem. 1987;56:615–649. doi: 10.1146/annurev.bi.56.070187.003151. - DOI - PubMed
    1. Vetter IR, Wittinghofer A. The guanine nucleotide-binding switch in three dimensions. Science. 2001;294:1299–1304. doi: 10.1126/science.1062023. - DOI - PubMed

Publication types

MeSH terms

Substances