

Optimized Diffusion-Weighting Gradient Waveform Design (ODGD) formulation for motion compensation and concomitant gradient nulling
- PMID: 30394568
- PMCID: PMC6289642
- DOI: 10.1002/mrm.27462
Optimized Diffusion-Weighting Gradient Waveform Design (ODGD) formulation for motion compensation and concomitant gradient nulling
Abstract
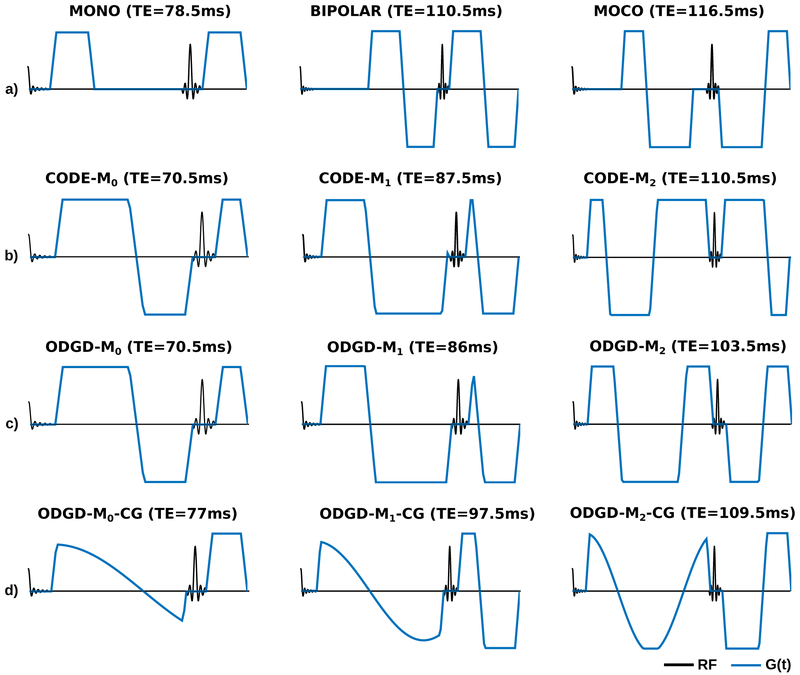
Purpose: To present a novel Optimized Diffusion-weighting Gradient waveform Design (ODGD) method for the design of minimum echo time (TE), bulk motion-compensated, and concomitant gradient (CG)-nulling waveforms for diffusion MRI.
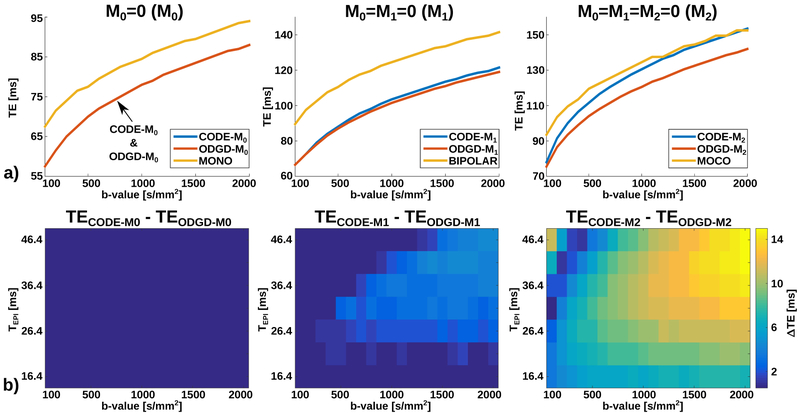
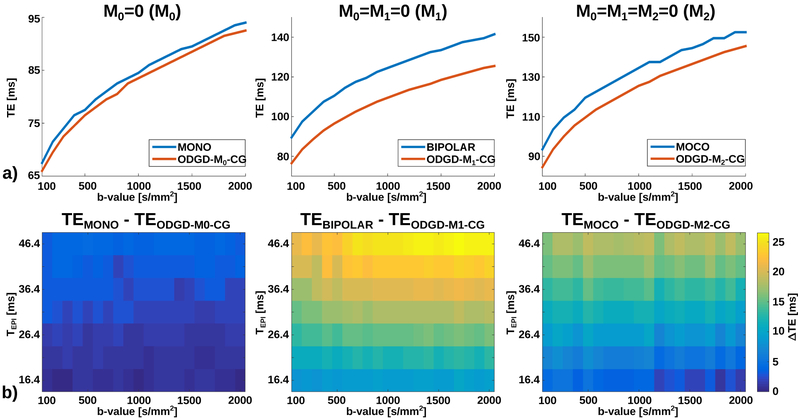
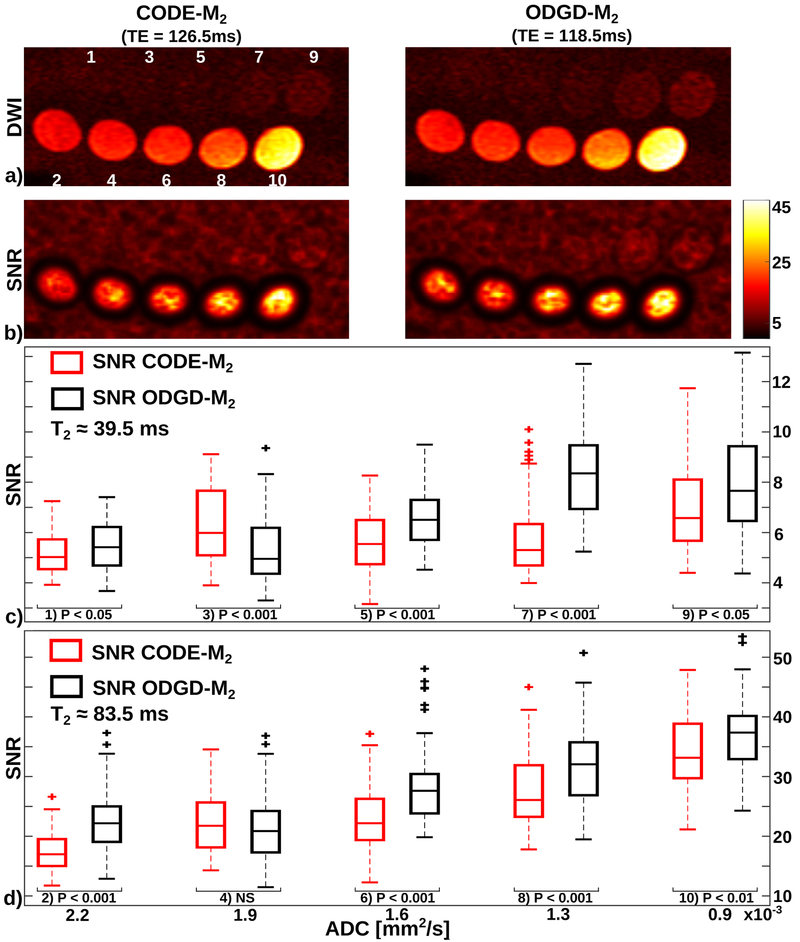
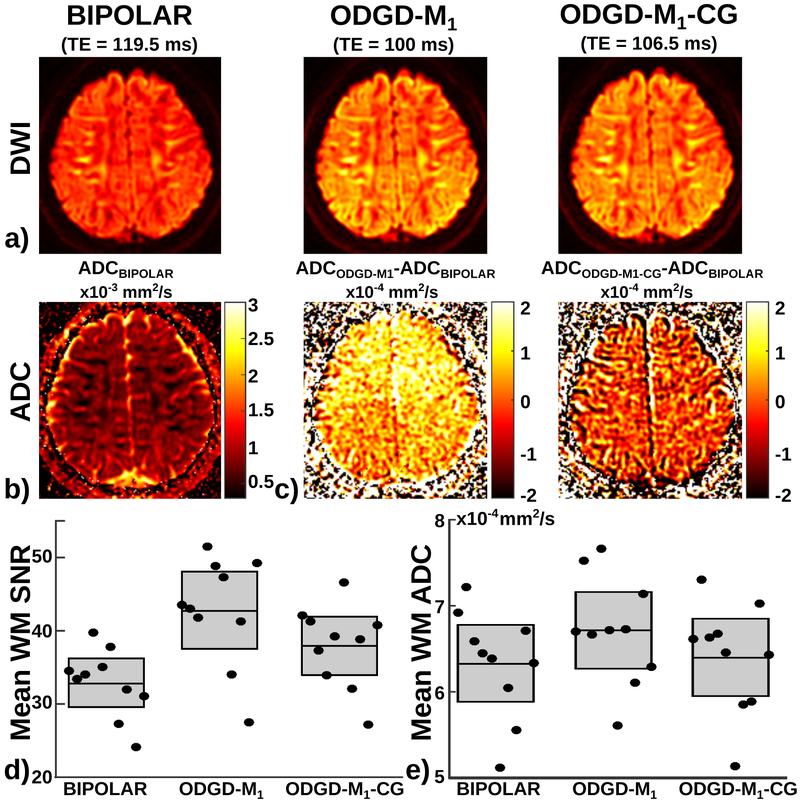
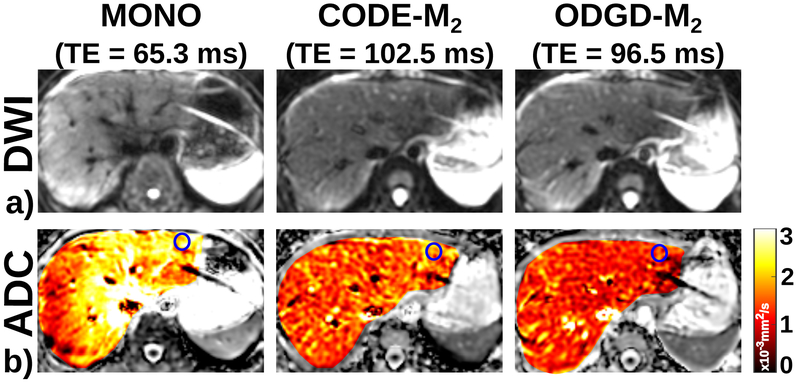
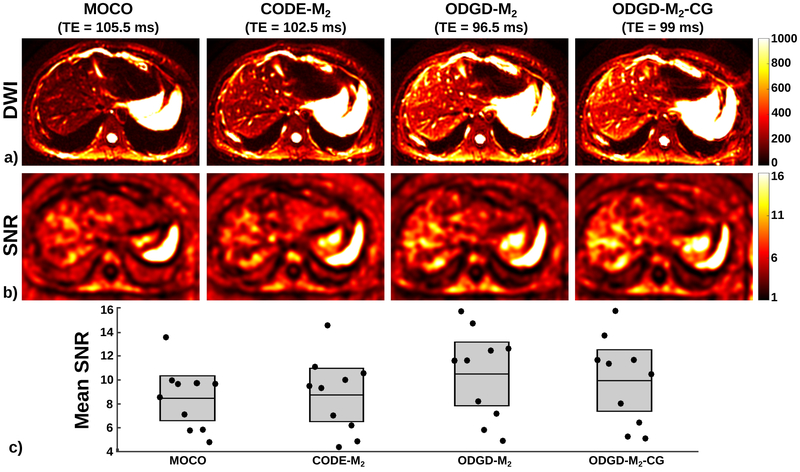
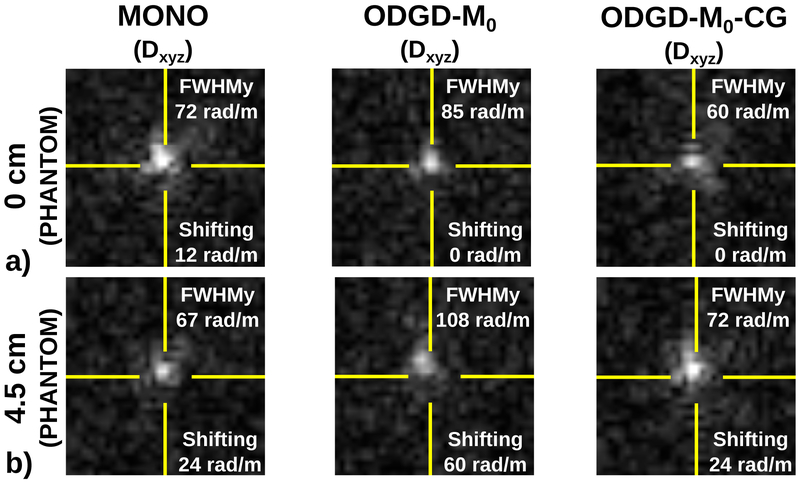
Methods: ODGD motion-compensated waveforms were designed for various moment-nullings Mn (n = 0, 1, 2), for a range of b-values, and spatial resolutions, both without (ODGD-Mn ) and with CG-nulling (ODGD-Mn -CG). Phantom and in-vivo (brain and liver) experiments were conducted with various ODGD waveforms to compare motion robustness, signal-to-noise ratio (SNR), and apparent diffusion coefficient (ADC) maps with state-of-the-art waveforms.
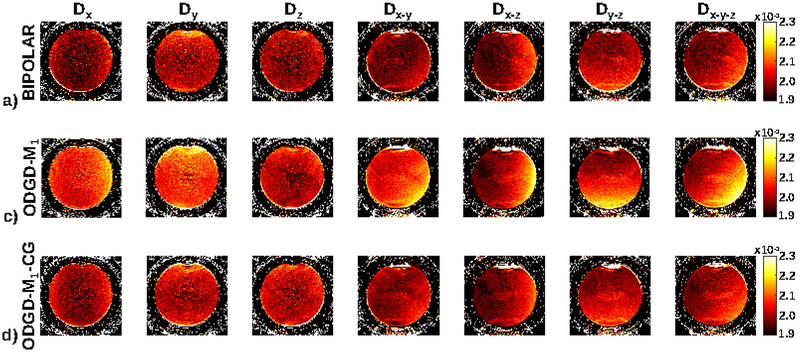
Results: ODGD-Mn and ODGD-Mn -CG waveforms reduced the TE of state-of-the-art waveforms. This TE reduction resulted in significantly higher SNR (P < 0.05) in both phantom and in-vivo experiments. ODGD-M1 improved the SNR of BIPOLAR (42.8 ± 5.3 vs. 32.9 ± 3.3) in the brain, and ODGD-M2 the SNR of motion-compensated (MOCO) and Convex Optimized Diffusion Encoding-M2 (CODE-M2 ) (12.3 ± 3.6 vs. 9.7 ± 2.9 and 10.2 ± 3.4, respectively) in the liver. Further, ODGD-M2 also showed excellent motion robustness in the liver. ODGD-Mn -CG waveforms reduced the CG-related dephasing effects of non CG-nulling waveforms in phantom and in-vivo experiments, resulting in accurate ADC maps.
Conclusions: ODGD waveforms enable motion-robust diffusion MRI with reduced TEs, increased SNR, and reduced ADC bias compared to state-of-the-art waveforms in theoretical results, simulations, phantoms and in-vivo experiments.
Keywords: Concomitant Gradient (CG)-nulling; Diffusion-Weighted Imaging (DWI); diffusion-weighting gradient waveforms; motion compensation; optimization.
© 2018 International Society for Magnetic Resonance in Medicine.
Figures
Similar articles
-
Convex optimized diffusion encoding (CODE) gradient waveforms for minimum echo time and bulk motion-compensated diffusion-weighted MRI.Magn Reson Med. 2017 Feb;77(2):717-729. doi: 10.1002/mrm.26166. Epub 2016 Feb 22. Magn Reson Med. 2017. PMID: 26900872
-
Motion-robust and blood-suppressed M1-optimized diffusion MR imaging of the liver.Magn Reson Med. 2019 Jul;82(1):302-311. doi: 10.1002/mrm.27735. Epub 2019 Mar 12. Magn Reson Med. 2019. PMID: 30859628
-
Phase stabilization with motion compensated diffusion weighted imaging.Magn Reson Med. 2024 Dec;92(6):2312-2327. doi: 10.1002/mrm.30218. Epub 2024 Jul 12. Magn Reson Med. 2024. PMID: 38997801
-
Eddy current nulled constrained optimization of isotropic diffusion encoding gradient waveforms.Magn Reson Med. 2019 Mar;81(3):1818-1832. doi: 10.1002/mrm.27539. Epub 2018 Oct 10. Magn Reson Med. 2019. PMID: 30368913 Free PMC article.
-
Gradient waveform design for tensor-valued encoding in diffusion MRI.J Neurosci Methods. 2021 Jan 15;348:109007. doi: 10.1016/j.jneumeth.2020.109007. Epub 2020 Nov 23. J Neurosci Methods. 2021. PMID: 33242529 Free PMC article. Review.
Cited by
-
Diffusion Tensor Imaging of Skeletal Muscle Contraction Using Oscillating Gradient Spin Echo.Front Neurol. 2021 Feb 15;12:608549. doi: 10.3389/fneur.2021.608549. eCollection 2021. Front Neurol. 2021. PMID: 33658976 Free PMC article.
-
A gradient optimization toolbox for general purpose time-optimal MRI gradient waveform design.Magn Reson Med. 2020 Dec;84(6):3234-3245. doi: 10.1002/mrm.28384. Epub 2020 Jul 7. Magn Reson Med. 2020. PMID: 33463724 Free PMC article.
-
Prospective motion correction for diffusion weighted EPI of the brain using an optical markerless tracker.Magn Reson Med. 2021 Mar;85(3):1427-1440. doi: 10.1002/mrm.28524. Epub 2020 Sep 29. Magn Reson Med. 2021. PMID: 32989859 Free PMC article.
-
Optimization methods for magnetic resonance imaging gradient waveform design.NMR Biomed. 2020 Dec;33(12):e4308. doi: 10.1002/nbm.4308. Epub 2020 Apr 27. NMR Biomed. 2020. PMID: 32342560 Free PMC article.
-
Precision of liver and pancreas apparent diffusion coefficients using motion-compensated gradient waveforms in DWI.Magn Reson Imaging. 2024 Jul;110:161-169. doi: 10.1016/j.mri.2024.04.026. Epub 2024 Apr 18. Magn Reson Imaging. 2024. PMID: 38641212
References
-
- Taouli B, Koh DM. Diffusion-weighted MR imaging of the liver 1. Radiology 2009;254:47–66. - PubMed
-
- Koh DM, Collins DJ. Diffusion-weighted MRI in the body: applications and challenges in oncology. American Journal of Roentgenology 2007;188:1622–1635. - PubMed
-
- Stejskal EO, Tanner JE. Spin diffusion measurements: spin echoes in the presence of a time-dependent field gradient. The journal of chemical physics 1965;42:288–292.
-
- Le Bihan D, Breton E, Lallemand D, Grenier P, Cabanis E, Laval-Jeantet M. MR imaging of intravoxel incoherent motions: application to diffusion and perfusion in neurologic disorders. Radiology 1986;161:401–407. - PubMed
MeSH terms
Substances
Grants and funding
LinkOut - more resources
Full Text Sources
Other Literature Sources
