. 2018 Nov 19;47(4):464-478.e8.
doi: 10.1016/j.devcel.2018.10.012. Epub 2018 Nov 1.

Activity of the SPCA1 Calcium Pump Couples Sphingomyelin Synthesis to Sorting of Secretory Proteins in the Trans-Golgi Network

Affiliations

Activity of the SPCA1 Calcium Pump Couples Sphingomyelin Synthesis to Sorting of Secretory Proteins in the Trans-Golgi Network

Yongqiang Deng et al. Dev Cell. .

Abstract

How the principal functions of the Golgi apparatus-protein processing, lipid synthesis, and sorting of macromolecules-are integrated to constitute cargo-specific trafficking pathways originating from the trans-Golgi network (TGN) is unknown. Here, we show that the activity of the Golgi localized SPCA1 calcium pump couples sorting and export of secreted proteins to synthesis of new lipid in the TGN membrane. A secreted Ca2+-binding protein, Cab45, constitutes the core component of a Ca2+-dependent, oligomerization-driven sorting mechanism whereby secreted proteins bound to Cab45 are packaged into a TGN-derived vesicular carrier whose membrane is enriched in sphingomyelin, a lipid implicated in TGN-to-cell surface transport. SPCA1 activity is controlled by the sphingomyelin content of the TGN membrane, such that local sphingomyelin synthesis promotes Ca2+ flux into the lumen of the TGN, which drives secretory protein sorting and export, thereby establishing a protein- and lipid-specific secretion pathway.

Keywords: Ca2+; Cab45; Cofilin; F-actin; Golgi apparatus; SPCA1; cargo sorting; secretion; sphingolipid metabolism; sphingomyelin.


Conflict of interest statement

Declaration of Interest:

The authors declare no competing interests.

Figures
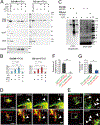
Figure 1.
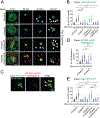
Figure 1.. Comparative proteomics of Golgi-derived vesicles identifies Cab45 as a cargo of the sphingomyelin secretion pathway.
(A) Preparation of Golgi-derived vesicles. Cell lines expressing EQ-SM-APEX2 or EQ-sol-APEX2 were permeabilized and then incubated with rat liver cytosol, ATP generating reaction components, at 32ºC or on ice for 45 minutes, as indicated. Released vesicular material was collected by centrifugation and the relative proportions of EQ-SM-APEX2 or EQ-sol-APEX2, β1,4-galactosyltransferase (GalT; a resident of late Golgi compartments), calnexin (CNX; an ER resident), and Cab45, in each fraction were determined by immunoblotting. Note that EQ-SM-APEX2, EQ-sol-APEX2, and Cab45 are detected in the budded vesicle fractions, but GalT (a Golgi resident) and CNX (an ER resident) are not. An example experiment for EQ-SM-APEX2 and EQ-sol-APEX2 is shown. Proteomic analyses were performed for two independent vesicle preparations. See also Table S1. (B) Proportions of EQ-SM-APEX2 and EQ-sol-APEX2 in vesicle fractions. The fold increases in the amounts of EQ-SM-APEX2 and EQ-sol-APEX2 in the vesicle fractions (mean ± s.d.; 3 independent experiments) are plotted. (C) Purification of biotinylated proteins from vesicle fractions. Vesicle fractions from EQ-SM-APEX2 or EQ-sol-APEX2 expressing or control (no EQ probe) cells were incubated with APEX-mediated biotinylation reagents, unless otherwise noted. Detergent (1% TritonX-100 and 0.1% SDS) was added to solubilize vesicle-associated proteins and biotinylated proteins were purified using immobilized streptavidin. An aliquot of each purified fraction was separated by SDS-PAGE and proteins were visualized by silver stain. Biotinylated proteins in each fraction were identified by blotting with fluorescent streptavidin. The migration of protein molecular mass standards is indicated to the right of each gel. (D) Example micrographs of cells expressing eGFP-Cab45 and EQ-SM-mKate2. Each micrograph shows the Golgi and surrounding cytoplasm of cells expressing the indicated fluorescent proteins. Cab45–6EQ is an engineered variant of Cab45 that does not bind Ca2+. To quantify the proportion of Golgi-derived vesicles containing both proteins, time-lapse movies were acquired and examined to identify vesicular/tubular profiles that underwent budding and fission from the Golgi apparatus. The arrowheads indicate a budding vesicle. Data was collected from 3 independent experiments. Merge bars, 10 μm. Zoom bars, 2 μm. (E) LyzC is exported from the Golgi in vesicles marked by EQ-SM, but not EQ-sol. Images of the Golgi region of cells expressing mCherry-tagged LyzC and EQ-SM-oxGFP or EQ-sol-oxGFP are shown. Arrowheads point to post-Golgi cytoplasmic vesicles. Merge bars, 10 μm. Zoom bars, 2 μm. (F) The mean (± s.d.) proportion of 26 budding events from 4 cells expressing eGFP-Cab45 and EQ-SM as well as 32 budding events from 9 cells expressing eGFP-Cab45–6EQ and EQ-SM are plotted. Data was collected from 2 independent experiments. (G) The mean (± s.d.) proportion of detected postGolgi LyzC vesicles that were either EQ-SM (n=185 vesicles from 6 cells) or EQ-sol (n=146 vesicles from 5 cells) positive was quantified. Data was collected from 2 independent experiments.
Figure 2.
Figure 2.. Cab45 oligomerization and client binding requires EF hand modules 1 and 3.
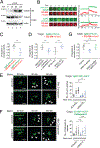
(A) Model of Cab45 EF hand modules. Structural modeling predicts that contiguous pairs of EF hands function as independent Ca2+-binding modules (Crevenna et al., 2016); EF hand module 1 (consisting of EF hands 1 and 2) is orange, EF hand module 2 (consisting of EF hands 3 and 4) is blue, and EF hand module 3 (consisting of EF hands 5 and 6) is green. The positions and amino acid side chains of calcium binding glutamic acid residues from each module are indicated. These residues were replaced by Glutamine in Cab45 EFh mutants to disable Ca2+ binding. (B) In vitro oligomerization assay analyzed by confocal microscopy. Recombinant Cab45-WT and the Cab45-EFh1, Cab45-EFh2, Cab45-EFh3 and Cab45-EFh1+3 mutants labeled with ATTO488, were incubated in Ca2+-free buffer or with 1 mM CaCl2. Bars, 10 μm. Arrowheads indicate fluorescent puncta of Cab45 oligomers. (C) Quantification of in vitro oligomerization assay. Data are presented as mean number of Cab45 puncta per 10−3 mm2 area from 12 regions of interest (± s.d.) from 2 independent experiments. See also Figure S1.
Figure 3.
Figure 3.. Ca2+ binding by Cab45 is required for sorting of a Cab45 client, lysozyme C (LyzC), into Golgi-derived vesicles.
(A) HeLa cells were transfected with Cab45 siRNA and a plasmid that directs expression of siRNA-insensitive HA-epitope tagged Cab45-WT, or the Ca2+ binding defective Cab45–6EQ mutant variant. All cells were co-transfected with plasmids that direct expression of a LyzC – streptavidin binding peptide (SBP) – eGFP fusion protein (LyzC-SBP-eGFP), and streptavidin-KDEL ‘anchor’ that confers ER retention of SBP-containing proteins. Biotin was added to the culture medium to elicit release of LyzC-SBP-eGFP from the ER (0 min). Micrographs were captured after fixing cells 20, 40, and 60 minutes after biotin addition and the number of cytoplasmic vesicles was determined at each time point. Arrowheads point to cytoplasmic vesicles. Note that Golgi derived vesicles containing LyzC-SBP-eGFP are abundant in the cytoplasm of cells that express native, but not Ca2+ binding defective, Cab45. Magenta arrowheads point to Cab45–6EQ cytoplasmic vesicles that localize to distinct vesicles from LyzC-SBP-eGFP. See also Fig S1. Vesicle counts from at least 22 cells per condition are plotted in (B). The means of 3 independent experiments (± s.d.) are plotted. (C) Cathepsin D and lysozyme C fusion proteins are exported from the Golgi in different vesicles. HeLa cells were transfected with plasmids that direct expression of LyzC-SBP-eGFP or SS-SBP-tagRFP-Cathepsin D fusion proteins. Proteins were released from the ER by the addition of biotin and the cargo loads of Golgi derived cytoplasmic vesicles was determined as described in the legend to panel A. Micrographs show representative cells 40 minutes after release of cargo from the ER. Bars, 5 μm. (D) Export of Cathepsin D from the Golgi is unaffected by Cab45 gene silencing. The SS-SBP-eGFP-Cathepsin D fusion protein was released from the ER of Cab45 siRNA-silenced, or control, cells by addition of biotin. The mean number of post-Golgi vesicles per cell (>39 cells per condition, ± s.d.) are plotted from 3 independent experiments as a function of time. Vesicle counts for Cab45 siRNA and control siRNA cell populations are not statistically significant. (E) Ca2+ binding by EFh modules 1 and 3 is required for efficient export of LyzC from the Golgi apparatus. Cells were depleted of endogenous Cab45 by siRNA and siRNA-insensitive Cab45 cDNAs with mutations in each of the EF hand modules were expressed. The number of cytoplasmic vesicles containing LyzC-SBP-eGFP per cell was determined after release of LyzC-SBP-eGFP from the ER. Only the data for EFh2 and EFh1+3 are shown in this figure; additional data is shown in Fig. S1. The mean vesicle counts from at least 38 cells per condition (± s.d.) are plotted.
Figure 4.
Figure 4.. Cab45, LyzC, and EQ-SM are exocytosed via the same vesicles in a sphingomyelin synthesis dependent manner.
(A) Cell culture supernatants and whole cell lysates of HeLa cells were collected after 0, 30, 60 and 120 min incubation with cycloheximide (CHX) and probed for Cab45 by immunoblotting. (B) Time-lapse gallery of Cab45, LyzC, and EQ-SM exocytosis. Galleries show example exocytic events of pHluorin-Cab45 or LyzC, and EQ-SM-mKate2 captured by TIRFM. The corresponding graphs show the summed fluorescence intensities for each frame in each channel over time. (C) LyzC is co-sorted with EQ-SM, but not EQ-sol, into exocytic vesicles. The mean proportions of exocytic events observed in 3 independent experiments (± s.d.) where LyzC-pHluorin containing vesicles also released mKate2-tagged EQ-SM or EQ-sol are indicated (362 events/15 cells for LyzC+EQ-SM and 268 events/12 cells for LyzC+EQ-sol). (D) Cab45 EFh1 and EFh3 and SPCA1 are required for cosorting of LyzC and EQ-SM. Genome edited Cab45 null cells expressed Cab45-WT or Cab45EFh1+3-mut by transfection or genome edited SPCA1 null cells that expressed or did not express SPCA1-WT by transfection. The cargo loads of exocytic vesicles were determined as described for (B). The means (± s.d.) are shown for n=239 events/14 cells for Cab45-WT, n=128 events/10 cells for Cab45-EFh1+3, n=163 events/10 cells for SPCA1-KO, n=157 events/10 cells for SPCA1-WT. (E) Depletion of sphingomyelin synthases (SMS1 and SMS2) delays export of LyzC-SBP-eGFP from the Golgi apparatus. HeLa cells were transfected with siRNAs targeting SMS1 and SMS2 or non-targeted control for two days prior to transfection with a plasmid that directs expression of LyzC-SBP-eGFP and the Streptavidin-KDEL ‘anchor’. The number of cytoplasmic vesicles per cell was determined at the indicated time points after release of LyzC-SBP-eGFP from the ER by addition of biotin. Arrowheads point to cytoplasmic vesicles. Bars, 10 μm. Vesicle counts (mean ± s.d.) from at least 18 cells per condition in 3 independent experiments are plotted in the graph on the right. (F) Depletion of SMS1 and SMS2 does not delay export of SS-SBP-eGFP-Cathepsin D vesicles from the Golgi apparatus. Arrowheads point to cytoplasmic vesicles. Assays were conducted as in (A). Bars, 10 μm. Vesicle counts from at least 18 cells per condition in 3 independent experiments are plotted (mean ± s.d.). (G) TIRF microscopy-based sorting assays were used to determine the proportion of LyzC-pHluorin exocytic vesicles that also contained EQ-SM-mKate2 (mean ± s.d.) in genome edited HeLa cells (SMS1/2-edited) that express SMS1 and SMS2 at reduced levels. See also Figure S3.
Figure 5.
Figure 5.. SPCA1 associates with sphingolipid in Golgi membrane.
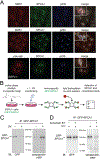
(A) SMS1, SPCA1, and pacSph localize to the TGN. Antisera to SPCA1, p230 (TGN), or GM130 (cis Golgi) were used to detect each protein by immunofluorescence microscopy in gene edited HeLa cells. To detect endogenous SMS1, a SMS1-SNAP tag fusion protein (constructed by genome editing) was labeled with SNAP-Cell 647-SiR. To visualize sphingolipids in situ, sphingosine-1-phosphate lyase deficient (SGPL1-) HeLa cells were pulse labeled with 0.6 μM pacSph for 30 minutes, followed by a chase period of 1 hour. Fixed, permeabilized cells were incubated with click chemistry reagents to covalently attach Alexa647 fluorophore to pacSph. Cells were visualized by deconvolution fluorescence microscopy. Quantitative evaluation of co-localization was accomplished by determining Pearson’s correlation coefficients (Table S2). Scale bars, 10 μm. Insets in the merged images show a higher magnification view of the Golgi region. (B) Schematic diagram of protocol used to test for UV-induced crosslinking of SPCA1 and pacSph. (C) SPCA1 and pacSph can be crosslinked. The left panel is an anti-GFP immunoblot showing GFP-SPCA1 that was immunopurified from the UV treated and untreated samples. In the right hand blot, the same samples were probed with streptavidin-HRP to detect pacSph crosslinked to SPCA1. (D) An inhibitor of ceramide synthase, fumonisin B1, prevents crosslinking of SPCA1 and pacSph. Cells were incubated with fumonisin B1 (50 μM) for 24 hours prior to initiating the pulse labeling with pacSph. The left and right hand blots were processed as in panel C. See also Figure S4 and Table S2.
Figure 6.
Figure 6.. SM depletion inhibits Ca2+ influx into the TGN.
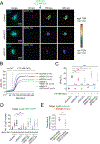
(A) Example time-lapse images of Golgi Ca2+ influx assays in control, siRNA SMS1/2 or SPCA1 depleted HeLa cells expressing the Go-D1-cpv Golgi Ca2+ sensor. Fluorescence micrographs of the FRET sensor in the TGN are shown in the left column. Cells were incubated with ionomycin to deplete Ca2+ from the lumen of the TGN and then live-cell ratiometric FRET microscopy was used to monitor Ca2+ influx by measuring the ΔR/R0 FRET ratio of YFP/CFP channels over time after addition of 2.2 mM CaCl2 to the cell medium, where R0 is the FRET ratio value obtained before addition of 2.2 mM CaCl2 (20 second time point). The color-coded ΔR/R0 heat map scale is shown on the right. Images are shown for representative cells 160 and 300 seconds after addition of CaCl2 at 80 sec. Scale bars, 5 μm. (B) Quantification of FRET images shown in A, as well as that of siRNA-treated cells expressing siRNA-insensitive SMS1 or SPCA1 cDNAs. Fluorescence signals reflecting TGN [Ca2+] are presented as ΔR/R0. Data are plotted as the mean Ca2+ influx over time. Data was acquired for at least 12 cells per condition in two independent experiments. (C) Data shown in B are plotted as the mean ± s.d Ca2+ influx before Ca2+ addition (at 80 sec) or after Ca2+ addition (at 300 sec). Data was acquired for at least 12 cells per condition in two independent experiments. (D) The number of LyzC vesicles was quantified in HeLa control or SMS1/2 siRNA depleted cells expressing either LyzC-SBP-eGFP alone, or co-transfected with SMS1-WT or SPCA1-WT. Vesicle counts from at least 18 cells per condition in 3 independent experiments are plotted. (E) TIRF microscopy-based sorting assays were used to determine the proportion of LyzC-pHluorin exocytic vesicles that also contained EQ-SM-mKate2 in SMS1/2edited cells that express either SPCA1-WT or SPCA1-D350A, a mutant that has no Ca2+ influx activity (means ± s.d. in 3 independent experiments; total of 201 events/13 cells for SPCA1-WT; total of 144 events/11 cells for SPCA1-D350A). See also Figure S5.
Figure 7.
Figure 7.. SPCA1 links sphingomyelin synthesis to Ca2+ dependent secretory protein and lipid sorting in the TGN.
The model depicts the events leading to the sorting and export of secretory cargo from the TGN, where the convergence of sphingomyelin synthesis and Ca2+ import into the lumen of the TGN drives the formation of a secretory carrier enriched in Cab45client complexes. Secretory cargo sorting is initiated by SPCA1-mediated Ca2+ influx, which is triggered by binding of ADF/cofilin1 to SPCA1 in the cytoplasm, where F-actin is associated with the TGN membrane. Synthesis of sphingomyelin in the TGN membrane potentiates SPCA1 mediated Ca2+ pumping in a region of the TGN membrane enriched in sphingomyelin. The local elevation of lumenal Ca2+ drives oligomerization of Cab45, which binds to soluble secretory protein clients, condensing them from the bulk milieu. The second product of SM synthesis, diacylglycerol (DAG), promotes engulfment of Cab45-client complexes by generating negative membrane curvature, leading to the formation of a secretory carrier enriched in oligomeric Cab45-client complexes.

Similar articles

Cited by

References

    1. Ang SF, Fölsch H, 2012. The role of secretory and endocytic pathways in the maintenance of cell polarity. Essays Biochem. 53, 29–39. doi:10.1042/bse0530029 - DOI - PMC - PubMed
    1. Anitei M, Hoflack B, 2011. Exit from the trans-Golgi network: from molecules to mechanisms. Curr. Opin. Cell Biol 23, 443–451. doi:10.1016/j.ceb.2011.03.013 - DOI - PubMed
    1. Barenholz Y, Thompson TE, 1980. Sphingomyelins in bilayers and biological membranes. Biochim Biophys Acta 604, 129–158. - PubMed
    1. Baron CL, Malhotra V, 2002. Role of diacylglycerol in PKD recruitment to the TGN and protein transport to the plasma membrane. Science 295, 325–328. doi:10.1126/science.1066759 - DOI - PubMed
    1. Baron S, Vangheluwe P, Sepúlveda MR, Wuytack F, Raeymaekers L, Vanoevelen J, 2010. The secretory pathway Ca(2+)-ATPase 1 is associated with cholesterol-rich microdomains of human colon adenocarcinoma cells. Biochim Biophys Acta 1798, 1512–1521. doi:10.1016/j.bbamem.2010.03.023 - DOI - PubMed

Publication types

MeSH terms