. 2018 Dec 1;201(11):3258-3268.
doi: 10.4049/jimmunol.1800393. Epub 2018 Oct 29.

Integrated B Cell, Toll-like, and BAFF Receptor Signals Promote Autoantibody Production by Transitional B Cells

Affiliations

Integrated B Cell, Toll-like, and BAFF Receptor Signals Promote Autoantibody Production by Transitional B Cells

Samuel W Du et al. J Immunol. .

Abstract

The B cell survival cytokine BAFF has been linked with the pathogenesis of systemic lupus erythematosus (SLE). BAFF binds distinct BAFF-family surface receptors, including the BAFF-R and transmembrane activator and CAML interactor (TACI). Although originally characterized as a negative regulator of B cell activation, TACI signals are critical for class-switched autoantibody (autoAb) production in BAFF transgenic mice. Consistent with this finding, a subset of transitional splenic B cells upregulate surface TACI expression and contribute to BAFF-driven autoAb. In the current study, we interrogated the B cell signals required for transitional B cell TACI expression and Ab production. Surprisingly, despite established roles for dual BCR and TLR signals in autoAb production in SLE, signals downstream of these receptors exerted distinct impacts on transitional B cell TACI expression and autoAb titers. Whereas loss of BCR signals prevented transitional B cell TACI expression and resulted in loss of serum autoAb across all Ig isotypes, lack of TLR signals exerted a more limited impact restricted to autoAb class-switch recombination without altering transitional B cell TACI expression. Finally, in parallel with the protective effect of TACI deletion, loss of BAFF-R signaling also protected against BAFF-driven autoimmunity. Together, these findings highlight how multiple signaling pathways integrate to promote class-switched autoAb production by transitional B cells, events that likely impact the pathogenesis of SLE and other BAFF-dependent autoimmune diseases.


Conflict of interest statement

Disclosures

The authors have no financial conflicts of interest.

Figures
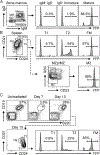
FIGURE 1.
FIGURE 1.
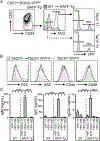
Fate-mapping strategy to distinguish transitional versus mature B cells. (A) Left, Gating strategy to identify IgMIgD pre–/pro–, IgM+IgD immature, and IgM+IgD+ mature B cells (gated on B220+) in BM of representative CD21cre.ROSA-YFPfl/fl mice. Right, YFP expression in indicated BM B cell subsets. (B) Splenic B cell developmental subset gating (top left; gated on CD19+B220+) and histogram showing YFP expression in indicated B cell subsets (top right). Lower panel, Gating of CD23lo MZ B cells within the CD21hiCD24hi MZ precursor (MZp)/MZ gate and histogram showing YFP expression in MZ B cells. (C) YFP expression in splenic B cells from CD21cre.ROSA-YFPfl/fl mice after irradiation/reconstitution. Upper left panels, FACS plot (gated on total splenocytes) showing splenic B cell depletion by day 7 postirradiation, with B cell reconstitution at day 13. Lower left panels, B cell developmental subsets following irradiation reconstitution (gated on CD19+B220+). Right, YFP expression in indicated B cell subsets on day 13 postirradiation. (A–C) Number indicates percentage within gate.
FIGURE 2.
FIGURE 2.
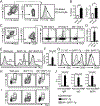
Fate-mapping demonstrating that activated sTACI+CD21lo B cells in BAFF-Tg mice are transitional B cells. (A) YFP expression in sTACI+ versus sTACI T1 B cells from CD21cre.ROSA-YFPfl/fl.BAFF-Tg mouse. Left, FACS plot (gated on CD19+ B cells) showing identification of CD21lo T1 B cells. Middle, Overlaid histograms showing sTACI expression in T1 B cells from WT (gray) and BAFF-Tg (line) CD21cre. ROSA-YFPfl/fl mice. Right, Histogram showing YFP labeling of sTACI+ (upper) versus sTACI (lower) T1 B cells from representative CD21cre.ROSA-YFPfl/fl. BAFF-Tg mouse, confirming similar proportion of YFPneg cells in each T1 subset. Number indicates percentage within gate. (B) Histograms showing size/granularity (based on forward scatter [FSC] and side scatter [SSC]) and expression of surface activation markers (CD44 and CD86) on YFPneg sTACI+ (solid line) and YFPpos sTACI+ (dashed line) T1 B cells from representative CD21cre.ROSA-YFPfl/fl.BAFF-Tg mouse. Gray histogram indicates sTACI T1 B cells. (C) Total IgM, IgG, and IgG2c in culture supernatants from sorted B cell subsets from WT and BAFF-Tg CD21cre.ROSA-YFPfl/fl reporter mice, with transitional subsets gated as YFP and mature B cells (FM and MZ) gated as YFP+. Data pooled from two independent sorts. Error bars indicate SEM. ****p < 0.0001 by one-way ANOVA, followed by Tukey multiple comparison test.
FIGURE 3.
FIGURE 3.
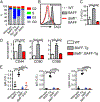
BCR signals promote transitional B cell activation and autoAb production. (A) Representative flow cytometry plots showing gating strategy for in vitro stimulation assays. Left panel, CD19+B220+ B cells following CD43 depletion of WT splenocytes at 13 d after sublethal irradiation. Middle panel, The majority of reconstituting B cells are CD21lo/midCD24hi T1/T2 B cells (gate drawn based on unirradiated WT controls [data not shown]). Right panel, Representative histogram of B cell sTACI expression with (black line), or without (gray shaded), anti-IgM (10 µg/ml) stimulation. Number indicates percentage within gate. (B) Percentage of sTACI+ B cells (left) and B cell Tnfrsf13b mRNA transcript expression (right) in media control (white) and anti-IgM–treated (black) transitional B cells. (C) Representative flow plots showing gating of CD19+B220+ B cells (left panel) and CD21loCD24hi T1 B cells (middle panel) after NP/Ficoll immunization. Right panel, Representative contour plots showing expansion of NP+TACI+ T1 B cells in WT, but not Btk−/−, mice at day 5 after NP/Ficoll immunization. Number indicates percentage within gate. (D) Percentage of NP+TACI+ B cells in T1 compartment in WT (black) and Btk−/− (gray) mice on indicated number of days after NP/Ficoll immunization. (E) sTACI expression in T1 B cells from WT, BAFF-Tg, and Btk−/−. BAFF-Tg mice. (F) Percentage of sTACI+ T1 B cells from indicated genotypes. (G) Overlaid flow plots showing side scatter (SSC), CD80, and CD86 expression in T1 B cells from WT (gray), BAFF-Tg (solid line), and Btk−/−.BAFF-Tg (dashed line) mice. (H and I) Representative FACS plots (gated on splenic T1 B cells) showing AID (H) and Blimp-1 (I) expression by sTACI+ T1 B cells from indicated genotypes. Number indicates percentage within gate. (J) Isotype-specific anti-Sm/RNP Ab from 12-wk-old WT (white), BAFF-Tg (black), and Btk−/−.BAFF-Tg (gray) mice. (B, D, F, and J) Error bars indicate SEM. (B) **p < 0.01, ****p < 0.0001 by two-tailed unpaired two-tailed Student t test. (D, F, and J) *p < 0.05, ****p < 0.0001 by one-way ANOVA, followed by Tukey multiple comparison test.
FIGURE 4.
FIGURE 4.
TLR signals promote CSR, but are redundant for transitional B cell TACI expression. (A and B) Percentage of sTACI+ B cells (A) and B cell Tnfrsf13b mRNA transcript expression (B) in transitional B cells stimulated in vitro with indicated combinations of anti-IgM (10 µg/ml), R848 (50 ng/ml), and recombinant murine BAFF (2 µg/ml). (C) sTACI expression in T1 B cells from WT (dashed line), BAFF-Tg (gray), Myd88−/−.BAFF-Tg (blue), and Tlr7−/−.BAFF-Tg (red) mice. (D and E) Percentage of T1 B cells expressing sTACI (D) and T1 B cell CD80 mean fluorescence intensity (MFI) (normalized to WT T1 B cells) (E) in WT (white), BAFF-Tg (gray), Myd88−/−.BAFF-Tg (blue), and Tlr7−/−.BAFF-Tg (red) mice. (F) Left, Cell-cycle analysis of T1 B cells from WT, BAFF-Tg (solid line), and Tlr7−/−.BAFF-Tg mice (dashed line). Right, Comparison of cell cycle in sTACI+ versus sTACI T1 B cells in BAFF-Tg (solid line) and Tlr7−/−.BAFF-Tg mice (dashed line). (G) Representative flow cytometry plots (gated on CD21loCD24hi splenic T1 B cells) showing expansion of NP+TACI+ T1 B cells in WT and Tlr7−/− mice at day 5 after NP/Ficoll immunization. Number indicates percentage within gate. (H) sTACI in T1 B cells (left panels) and intranuclear AID staining in sTACI+ (red line) versus sTACI (black line) T1 B cells (middle panels) from representative BAFF-Tg (upper) and Tlr7−/−.BAFF-Tg (lower) mice. (I) AID MFI (normalized to WT) in T1 B cells from WT (white), BAFF-Tg (gray), and Tlr7−/−.BAFF-Tg (red) mice. (J) Representative FACS plots (gated on splenic T1 B cells) showing Blimp-1+sTACI+ cells from indicated genotypes. Number indicates percentage within gate. (K) Anti-Sm/RNP IgM and IgG Ab from 12-wk-old WT (white), BAFF-Tg (gray), Tlr7−/− (blue), and Tlr7−/−. BAFF-Tg (red) mice. (A, B, D, E, I, and K) Error bars indicate SEM. *p < 0.05, **p < 0.01, ***p < 0.001, ****p < 0.0001 by one-way ANOVA, followed by Tukey multiple comparison test.
FIGURE 5.
FIGURE 5.
BAFF-R signals facilitate transitional B cell proliferation, activation, and autoAb production. (A) Cell-cycle analysis of T1 B cells from indicated genotypes. (B) sTACI expression in T1 B cells from representative WT (dashed line), BAFF-Tg (gray), and Baffr−/−.BAFF-Tg (red) mice. (C) Percentage of sTACI+ T1 B cells for indicated genotypes. (D) Mean fluorescence intensity (MFI) of surface activation markers CD44, CD80, and CD86 (normalized to WT) in T1 B cells from WT (white), BAFF-Tg (gray), and Baffr−/−.BAFF-Tg (red) mice. (E) Isotype-specific anti-Sm/RNP Ab in 12-wk-old WT (white), BAFF-Tg (gray), Baffr−/− (blue), and Baffr−/−.BAFF-Tg (red) mice. (C–E) Error bars indicate SEM. ****p < 0.0001 by one-way ANOVA, followed by Tukey multiple comparison test.
FIGURE 6.
FIGURE 6.
BTK, TLR7, and BAFF-R signals promote progressive IC glomerulonephritis in BAFF-Tg mice. (A) Immunofluorescence (IF) staining for glomerular IgG (upper), IgG2c (middle), and C3 (lower). Left panels, Representative images. Right panels, Intensity of glomerular IF staining scored by observers blinded to genotype. Scale bar, 50 µM. (B) Renal histopathology showing marked mesangial expansion, mesangiolysis, and hypercellularity within glomeruli of representative 10-mo-old BAFF-Tg mouse (upper left panel; arrows denote endocapillary deposits). In contrast, glomerular changes were inapparent in age-matched Btk−/−.BAFF-Tg, Tlr7−/−.BAFF-Tg, and Baffr−/−.BAFF-Tg mice. Scale bar, 50 µM. (C and D) Mean glomerular size (C) and mean cell count per glomerulus (D). (E and F) Urine albumin:creatinine ratio (ACR) (E) (microgram per milligram) and serum BUN (F). (A and C–F) Data from 10− to 12-mo-old WT (white), BAFF-Tg (red), Btk−/−.BAFF-Tg (black), Tlr7−/−.BAFF-Tg (blue), and Baffr−/−.BAFF-Tg (green) mice (n ≥ 5 per genotype). Error bars indicate SEM. *p < 0.05, **p < 0.01, ***p < 0.001, ****p < 0.0001 by one-way ANOVA, followed by Tukey multiple comparison test.

Similar articles

Cited by

References

    1. Groom JR, Fletcher CA, Walters SN, Grey ST, Watt SV, Sweet MJ, Smyth MJ, Mackay CR, and Mackay F 2007. BAFF and MyD88 signals promote a lupuslike disease independent of T cells. J. Exp. Med 204: 1959–1971. - PMC - PubMed
    1. Gavin AL, Duong B, Skog P, Aït-Azzouzene D, Greaves DR, Scott ML, and Nemazee D 2005. deltaBAFF, a splice isoform of BAFF, opposes full-length BAFF activity in vivo in transgenic mouse models. J. Immunol 175: 319–328. - PubMed
    1. Mackay F, Woodcock SA, Lawton P, Ambrose C, Baetscher M, Schneider P, Tschopp J, and Browning JL 1999. Mice transgenic for BAFF develop lymphocytic disorders along with autoimmune manifestations. J. Exp. Med 190: 1697–1710. - PMC - PubMed
    1. Stohl W, Metyas S, Tan SM, Cheema GS, Oamar B, Xu D, Roschke V, Wu Y, Baker KP, and Hilbert DM 2003. B lymphocyte stimulator over-expression in patients with systemic lupus erythematosus: longitudinal observations. Arthritis Rheum 48: 3475–3486. - PubMed
    1. Steri M, Orrù V, Idda ML, Pitzalis M, Pala M, Zara I, Sidore C, Faà V, Floris M, Deiana M, et al. 2017. Overexpression of the cytokine BAFF and autoimmunity risk. N. Engl. J. Med 376: 1615–1626. - PMC - PubMed

Publication types

MeSH terms