Sex- and region-specific differences in microglia phenotype and characterization of the peripheral immune response following early-life infection in neonatal male and female rats
- PMID: 30367955
- PMCID: PMC6351186
- DOI: 10.1016/j.neulet.2018.10.044
Sex- and region-specific differences in microglia phenotype and characterization of the peripheral immune response following early-life infection in neonatal male and female rats
Abstract
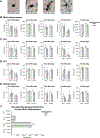
Early-life infection has been shown to have profound effects on the brain and behavior across the lifespan, a phenomenon termed "early-life programming". Indeed, many neuropsychiatric disorders begin or have their origins early in life and have been linked to early-life immune activation (e.g. autism, ADHD, and schizophrenia). Furthermore, many of these disorders show a robust sex bias, with males having a higher risk of developing early-onset neurodevelopmental disorders. The concept of early-life programming is now well established, however, it is still unclear how such effects are initiated and then maintained across time to produce such a phenomenon. To begin to address this question, we examined changes in microglia, the immune cells of the brain, and peripheral immune cells in the hours immediately following early-life infection in male and female rats. We found that males showed a significant decrease in BDNF expression and females showed a significant increase in IL-6 expression in the cerebellum following E.coli infection on postnatal day 4; however, for most cytokines examined in the brain and in the periphery we were unable to identify any sex differences in the immune response, at least at the time points examined. Instead, neonatal infection with E.coli increased the expression of a number of cytokines in the brain of both males and females similarly including TNF-α, IL-1β, and CD11b (a marker of microglia activation) in the hippocampus and, in the spleen, TNF-α and IL-1β. We also found that protein levels of GRO-KC, MIP-1a, MCP1, IP-10, TNF-α, and IL-10 were elevated 8-hours postinfection, but this response was resolved by 24-hours. Lastly, we found that males have more thin microglia than females on P5, however, neonatal infection had no effect on any of the microglia morphologies we examined. These data show that sex differences in the acute immune response to neonatal infection are likely gene, region, and even time dependent. Future research should consider these factors in order to develop a comprehensive understanding of the immune response in males and females as these changes are likely the initiating agents that lead to the long-term, and often sex-specific, effects of early-life infection.
Keywords: Cerebellum; Hippocampus; Microglia; Neonatal infection; Peripheral immune system; Sex differences.
Published by Elsevier B.V.
Figures


Similar articles
-
Neonatal infection produces significant changes in immune function with no associated learning deficits in juvenile rats.Dev Neurobiol. 2017 Oct;77(10):1221-1236. doi: 10.1002/dneu.22512. Epub 2017 Jul 25. Dev Neurobiol. 2017. PMID: 28719141 Free PMC article.
-
Early-life infection leads to altered BDNF and IL-1beta mRNA expression in rat hippocampus following learning in adulthood.Brain Behav Immun. 2008 May;22(4):451-5. doi: 10.1016/j.bbi.2007.10.003. Epub 2007 Nov 7. Brain Behav Immun. 2008. PMID: 17997277
-
Activation of neonatal microglia can be influenced by other neural cells.Neurosci Lett. 2017 Sep 14;657:32-37. doi: 10.1016/j.neulet.2017.07.052. Epub 2017 Jul 31. Neurosci Lett. 2017. PMID: 28774571 Free PMC article.
-
Immune dysregulation and cognitive vulnerability in the aging brain: Interactions of microglia, IL-1β, BDNF and synaptic plasticity.Neuropharmacology. 2015 Sep;96(Pt A):11-8. doi: 10.1016/j.neuropharm.2014.12.020. Epub 2014 Dec 27. Neuropharmacology. 2015. PMID: 25549562 Free PMC article. Review.
-
Convergence of Sex Differences and the Neuroimmune System in Autism Spectrum Disorder.Biol Psychiatry. 2017 Mar 1;81(5):402-410. doi: 10.1016/j.biopsych.2016.10.004. Epub 2016 Oct 11. Biol Psychiatry. 2017. PMID: 27871670 Free PMC article. Review.
Cited by
-
Sex-Specific Immune Responses in Stroke.Stroke. 2022 May;53(5):1449-1459. doi: 10.1161/STROKEAHA.122.036945. Epub 2022 Apr 25. Stroke. 2022. PMID: 35468002 Free PMC article. Review.
-
Frank Beach Award Winner - The future of mental health research: Examining the interactions of the immune, endocrine and nervous systems between mother and infant and how they affect mental health.Horm Behav. 2019 Aug;114:104521. doi: 10.1016/j.yhbeh.2019.04.008. Epub 2019 Apr 18. Horm Behav. 2019. PMID: 30981689 Free PMC article. Review.
-
Peri-adolescent asthma: Acute impacts on innate immune response, corticosterone, and microglia in mice.J Neuroimmunol. 2020 Nov 25;350:577450. doi: 10.1016/j.jneuroim.2020.577450. Online ahead of print. J Neuroimmunol. 2020. PMID: 33285450 Free PMC article.
-
The role of microglia in neuropsychiatric disorders and suicide.Eur Arch Psychiatry Clin Neurosci. 2022 Sep;272(6):929-945. doi: 10.1007/s00406-021-01334-z. Epub 2021 Sep 30. Eur Arch Psychiatry Clin Neurosci. 2022. PMID: 34595576 Free PMC article. Review.
-
Effects of sex and pro-inflammatory cytokines on context discrimination memory.Behav Brain Res. 2023 Mar 28;442:114320. doi: 10.1016/j.bbr.2023.114320. Epub 2023 Jan 30. Behav Brain Res. 2023. PMID: 36720350 Free PMC article.
References
Publication types
MeSH terms
Substances
Grants and funding
LinkOut - more resources
Full Text Sources
Medical
Research Materials
Miscellaneous

