Review
. 2018 Dec;19(12):789-800.
doi: 10.1038/s41576-018-0060-8.

Organizational principles of 3D genome architecture

Affiliations
Review

Organizational principles of 3D genome architecture

M Jordan Rowley et al. Nat Rev Genet. 2018 Dec.

Abstract

Studies of 3D chromatin organization have suggested that chromosomes are hierarchically organized into large compartments composed of smaller domains called topologically associating domains (TADs). Recent evidence suggests that compartments are smaller than previously thought and that the transcriptional or chromatin state is responsible for interactions leading to the formation of small compartmental domains in all organisms. In vertebrates, CTCF forms loop domains, probably via an extrusion process involving cohesin. CTCF loops cooperate with compartmental domains to establish the 3D organization of the genome. The continuous extrusion of the chromatin fibre by cohesin may also be responsible for the establishment of enhancer-promoter interactions and stochastic aspects of the transcription process. These observations suggest that the 3D organization of the genome is an emergent property of chromatin and its components, and thus may not be only a determinant but also a consequence of its function.


Conflict of interest statement

Competing Interests

The authors declare no competing interests.

Figures

Figure 1.
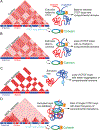
Figure 1.. Models of chromatin organization
A. The hierarchical model of chromatin organization suggests that different sized features contribute to each other’s formation. In this model, compartments are large multi-megabase structures of the 3D genome whereas TADs are substructures inside compartments. Top: Interaction signal (varying intensities of red) from low resolution Hi-C data partitioned into megabase-sized bins show. The panel represents a cartoon version of an actual Hi-C heatmap. The Eigenvector describes the first component of the Principal Component Analysis and identifies A (red) and B (blue) compartments, which correlate with mostly transcriptionally active and inactive regions of the genome, respectively. Middle: TADs are smaller regions of the genome identified with higher resolution Hi-C data partitioned into ~40 kb bins using an algorithm to detect changes in the directionality of interactions. The panel shows a small section of the genome corresponding to one B compartment and half A compartments in the diagram above. TATs contain smaller subTADs characterized by higher interaction frequencies (darker shade of red) and CTCF loops detected as strong punctate signal corresponding to strong interactions between CTCF sites. Note that only some TADs coincide with CTCF loops and CTCF is only present at the borders of some TADs. Only some CTCF loops are detected at this resolution. Bottom: Structure of a TAD as detected at ~40 kb resolution, containing two subTADs and flanked by CTCF/cohesin sites forming a loop. B. An alternative model of chromatin organization incorporates recent findings obtained with very high-resolution data partitioned in 1–5 kb bins. Top: The cartoon corresponds to the domain marked with an arrowhead in panel A and it is a representation of the actual Hi-C heatmap, emphasizing the complexity of interactions present in a region that appears as a uniform minute TAD in low resolution data. The Eigen vector obtained by binning the data at 5–20 kb allows the identification of compartmental domains, which accurately correspond to the active or inactive transcriptional state determined by GRO-seq. Punctate signal represent CTCF loops between sites in convergent orientation. Middle: Some CTCF loops encompass active and inactive compartmental domains, increasing interactions between these two domains that would normally not take place (left). Other CTCF loops encompass individual compartmental domains, and the formation of the loop decreases interactions between two adjacent domains (right). Therefore, the presence of CTCF loops modulates interactions among compartmental domains. Bottom: Segregation of chromatin states in the nucleus may occur as a consequence of the presence of different classes of multivalent proteins that mediate class-specific interactions to create different phases, wich result in droplets of distinct chromatin states within the nucleus. In the cartoon, red represents proteins and histone modifications present at genes or regulatory sequences in a transcriptionally active state, blue represents H3K27me3 and Polycom-Group proteins, and green represents H3K9me3 and HP1.
Figure 2.
Figure 2.. Mechanisms of loop extrusion
A. General model of loop extrusion. The extrusion process involves cohesin composed of SMC1, SMC3, and RAD21 which is loaded onto chromatin via NIPBL. Extrusion is blocked at CTCF sites arranged in a convergent head to head orientation. Some proportion of cohesin is released throughout this process by the activity of WAPL and PDS5. B. Extrusion via cohesin diffusion. Extrusion may occur by constant loading of cohesin resulting in a diffusion gradient. C. Extrusion via cohesin motor activity. An alternative explanation for extrusion is that the process is driven by the motor activity of cohesin via ATP hydrolysis. D. Extrusion via pushing of cohesin by RNAPII. Other factors able to move along chromatin, such as RNAPII (purple), may help cohesin to extrude DNA.
Figure 3.
Figure 3.. Effects of CTCF, cohesin, or WAPL depletion on 3D chromatin organization
A. Chromatin is organized in the 3D nuclear space by CTCF loops and compartmental domains. Some CTCF loops restrict the ability of active (red) and inactive (blue) regions to segregate into compartmental domains whereas others increase the frequency of interactions between two adjacent active and inactive domains (top right). B. Depletion of CTCF results in a loss of CTCF loops but no change in compartmental domain interactions, likely because cohesin is able to randomly continue extruding chromatin. C. Depletion of cohesin results in loss of CTCF loops, more distinct compartmental domains and stronger inter-compartmental interactions. D. Depletion of WAPL results in gain of longer CTCF loops and decrease of interactions among compartmental domains.
Figure 4.
Figure 4.. CTCF loops and enhancer-promoter interactions
A. CTCF loops establish domains in which sequences can interact more frequently. These contacts are thought to help promote enhancer (yellow with orange transcription factor) – promoter (pink with purple RNAPII) (E-P) interactions when inside the domain, but help insulate against those outside the domain. However, examples of genes that escape the CTCF domain and interact with adjacent sequences can be observed in Hi-C data (arrow). It is likely that these “escapee” genes interact with promoters or regulatory sequences within A compartmental domains (large light pink oval). B. A speculative model of transcriptional activation. In this model, genes are inactive when extrusion has not begun (top) and are activated once extrusion brings together enhancers and promoters (left). Gene activity is lost once extrusion moves past the enhancer or promoter (right), but will be reestablished during each extrusion event. Regular extrusion events causing gene activation at discrete times may explain transcriptional bursting.

Similar articles

Cited by

References

    1. Fraser J, Williamson I, Bickmore WA & Dostie J An Overview of Genome Organization and How We Got There: from FISH to Hi-C. Microbiol. Mol. Biol. Rev. MMBR 79, 347–372 (2015). - PMC - PubMed
    1. Stevens TJ et al. 3D structures of individual mammalian genomes studied by single-cell Hi-C. Nature 544, 59–64 (2017). - PMC - PubMed
    1. Nagano T et al. Single-cell Hi-C reveals cell-to-cell variability in chromosome structure. Nature 502, 59–64 (2013). - PMC - PubMed
    1. Beliveau BJ et al. Single-molecule super-resolution imaging of chromosomes and in situ haplotype visualization using Oligopaint FISH probes. Nat. Commun 6, 7147 (2015). - PMC - PubMed
    1. Ni Y et al. Super-resolution imaging of a 2.5 kb non-repetitive DNA in situ in the nuclear genome using molecular beacon probes. eLife 6, (2017). - PMC - PubMed

Publication types

MeSH terms

LinkOut - more resources