Generation of axenic Aedes aegypti demonstrate live bacteria are not required for mosquito development
- PMID: 30367055
- PMCID: PMC6203775
- DOI: 10.1038/s41467-018-07014-2
Generation of axenic Aedes aegypti demonstrate live bacteria are not required for mosquito development
Abstract
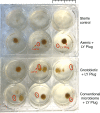
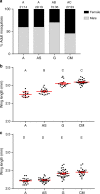
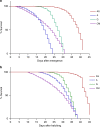
The mosquito gut microbiome plays an important role in mosquito development and fitness, providing a promising avenue for novel mosquito control strategies. Here we present a method for rearing axenic (bacteria free) Aedes aegypti mosquitoes, consisting of feeding sterilized larvae on agar plugs containing a high concentration of liver and yeast extract. This approach allows for the complete development to adulthood while maintaining sterility; however, axenic mosquito's exhibit delayed development time and stunted growth in comparison to their bacterially colonized cohorts. These data challenge the notion that live microorganisms are required for mosquito development, and suggest that the microbiota's main role is nutritional. Furthermore, we colonize axenic mosquitoes with simplified microbial communities ranging from a single bacterial species to a three-member community, demonstrating the ability to control the composition of the microbiota. This axenic system will allow the systematic manipulation of the mosquito microbiome for a deeper understanding of microbiota-host interactions.
Conflict of interest statement
The authors declare no competing interests.
Figures


Similar articles
-
Bacterial microbiota assemblage in Aedes albopictus mosquitoes and its impacts on larval development.Mol Ecol. 2018 Jul;27(14):2972-2985. doi: 10.1111/mec.14732. Epub 2018 Jun 17. Mol Ecol. 2018. PMID: 29845688 Free PMC article.
-
Natural Variation in Physicochemical Profiles and Bacterial Communities Associated with Aedes aegypti Breeding Sites and Larvae on Guadeloupe and French Guiana.Microb Ecol. 2021 Jan;81(1):93-109. doi: 10.1007/s00248-020-01544-3. Epub 2020 Jul 3. Microb Ecol. 2021. PMID: 32621210 Free PMC article.
-
Asaia spp. accelerate development of the yellow fever mosquito, Aedes aegypti, via interactions with the vertically transmitted larval microbiome.J Appl Microbiol. 2024 Nov 4;135(11):lxae261. doi: 10.1093/jambio/lxae261. J Appl Microbiol. 2024. PMID: 39419784
-
Axenic and gnotobiotic insect technologies in research on host-microbiota interactions.Trends Microbiol. 2023 Aug;31(8):858-871. doi: 10.1016/j.tim.2023.02.007. Epub 2023 Mar 10. Trends Microbiol. 2023. PMID: 36906503 Review.
-
The Axenic and Gnotobiotic Mosquito: Emerging Models for Microbiome Host Interactions.Front Microbiol. 2021 Jul 12;12:714222. doi: 10.3389/fmicb.2021.714222. eCollection 2021. Front Microbiol. 2021. PMID: 34322111 Free PMC article. Review.
Cited by
-
An obligate microsporidian parasite modulates defense against opportunistic bacterial infection in the yellow fever mosquito, Aedes aegypti.mSphere. 2024 Feb 28;9(2):e0067823. doi: 10.1128/msphere.00678-23. Epub 2024 Feb 7. mSphere. 2024. PMID: 38323845 Free PMC article.
-
Aedes spp. and Their Microbiota: A Review.Front Microbiol. 2019 Sep 4;10:2036. doi: 10.3389/fmicb.2019.02036. eCollection 2019. Front Microbiol. 2019. PMID: 31551973 Free PMC article. Review.
-
Impact of Gut Bacteria on the Infection and Transmission of Pathogenic Arboviruses by Biting Midges and Mosquitoes.Microb Ecol. 2020 Oct;80(3):703-717. doi: 10.1007/s00248-020-01517-6. Epub 2020 May 27. Microb Ecol. 2020. PMID: 32462391 Free PMC article.
-
Diet-Microbiota Interactions Alter Mosquito Development.Front Microbiol. 2021 Jun 8;12:650743. doi: 10.3389/fmicb.2021.650743. eCollection 2021. Front Microbiol. 2021. PMID: 34168624 Free PMC article.
-
Larval Diet Abundance Influences Size and Composition of the Midgut Microbiota of Aedes aegypti Mosquitoes.Front Microbiol. 2021 Jun 18;12:645362. doi: 10.3389/fmicb.2021.645362. eCollection 2021. Front Microbiol. 2021. PMID: 34220739 Free PMC article.
References
Publication types
MeSH terms
Substances
Grants and funding
LinkOut - more resources
Full Text Sources

