. 2018 Oct 25;19(1):174.
doi: 10.1186/s13059-018-1558-2.

Canonical and single-cell Hi-C reveal distinct chromatin interaction sub-networks of mammalian transcription factors

Affiliations

Canonical and single-cell Hi-C reveal distinct chromatin interaction sub-networks of mammalian transcription factors

Xiaoyan Ma et al. Genome Biol. .

Abstract

Background: Transcription factor (TF) binding to regulatory DNA sites is a key determinant of cell identity within multi-cellular organisms and has been studied extensively in relation to site affinity and chromatin modifications. There has been a strong focus on the inference of TF-gene regulatory networks and TF-TF physical interaction networks. Here, we present a third type of TF network, the spatial network of co-localized TF binding sites within the three-dimensional genome.

Results: Using published canonical Hi-C data and single-cell genome structures, we assess the spatial proximity of a genome-wide array of potential TF-TF co-localizations in human and mouse cell lines. For individual TFs, the abundance of occupied binding sites shows a positive correspondence with their clustering in three dimensions, and this is especially apparent for weak TF binding sites and at enhancer regions. An analysis between different TF proteins identifies significantly proximal pairs, which are enriched in reported physical interactions. Furthermore, clustering of different TFs based on proximity enrichment identifies two partially segregated co-localization sub-networks, involving different TFs in different cell types. Using data from both human lymphoblastoid cells and mouse embryonic stem cells, we find that these sub-networks are enriched within, but not exclusive to, different chromosome sub-compartments that have been identified previously in Hi-C data.

Conclusions: This suggests that the association of TFs within spatial networks is closely coupled to gene regulatory networks. This applies to both differentiated and undifferentiated cells and is a potential causal link between lineage-specific TF binding and chromosome sub-compartment segregation.

Keywords: Chromatin conformational capture; Chromosome compartment; Genome structure; Hi-C; Nuclear organization; Proximity network; Transcription factor.


Conflict of interest statement

Ethics approval and consent to participate

Not applicable.

Consent for publication

Not applicable.

Competing interests

The authors declare that they have no competing interests.

Publisher’s Note

Springer Nature remains neutral with regard to jurisdictional claims in published maps and institutional affiliations.

Figures
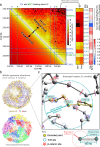
Fig. 1
Fig. 1
Measuring co-localization of TF sites in Hi-C contact maps and genome structures. a A schematic overview of using Hi-C contact data to quantify the spatial co-localization of TF binding sites, both within the same type and between different types. A section of a Hi-C contact map for human chromosome 9 at 5 kb resolution (upper right triangle) showing normalized contact counts of lymphoblastoid GM12878 cells [24] and the corresponding count expectation, given sequence separation (lower left). The illustrated color scale corresponds to the binned contact counts. Illustrative binding sites for two TFs (YY1:blue and NRF1:green), identified by a combination of ChIP-seq and sequence motif scans, are shown as dashed lines. Paired contact possibilities between these sites are shown on the Hi-C map at the intersections of these lines, and the corresponding observed and expected count values for each pair are extracted into separate columns (mid-right panel). For each TF:TF site pair, the log2(Observed/Expected) score is shown in the last column (right); it is the summation of these values that is used to calculate the CCL-scores for either a single TF (homotypic) of between different TFs (heterotypic). b Studying TF sites in a 3D genome structure calculated from single-cell Hi-C. A genome structure for a single cell, calculated using single-cell Hi-C, provides relative three-dimensional coordinate positions for all chromosomes, here modelled as 100-kb particles. The complete genome is shown as thin sections through the center of five aligned coordinate models and colored according to chromosome identity (bottom). The locations of TF binding sites within these structures can be identified (top). Here, β-catenin sites are shown in red and Tcf3 sites in blue. The data is shown for mouse ESC “Cell1” as published in Stevens et al. [36]. c Identifying co-localized TF sites in a genome structure. An enlarged section of one structure model shown in b shows the modelled chromatin backbone path (grey/yellow) and illustrates how TF sites within a specified radius of a query point (center of dashed circle) can be identified. The solid spheres represent the restrained points in the middle of 100-kb chromosome regions (so there is also 100 kb between points). The repulsive radius (r) used in the structure calculation, to separate the restrained points in 3D space, corresponds to half of the ideal sequential point separation (equivalent to 50 kb). The points that are close in sequence to the query (within 300 kb, either side), which are excluded from its analysis, are shown in yellow
Fig. 2
Fig. 2
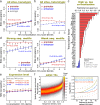
The general correspondence between TF presence and spatial co-localization. a Relating TF binding site occupancy with homotypic Hi-C contacts. Correspondences between mean homotypic occupancy and CCL-score (from Hi-C) for all TFs collectively are shown as regression plots and sub-divided according to promoter or enhancer classes (see the “Methods” section). For comparative purposes, the all-site average is shown in grey in the left panel. Accessible sites for different TFs were rank normalized, combined and grouped into ten bins according to CCL-score. Pearson’s R2 values are shown alongside the percentage change in occupancy change across the CCL range. Error bars indicate standard deviation from resampling. b Relating TF binding site occupancy with heterotypic Hi-C contacts. Similar to a, but considering interactions between different TF types. For a given site of a specific TF, interactions with all other heterotypic sites were considered collectively to define the integrated heterotypic CCL-score (Eq. 5). Data is separated according to whether sites are found in enhancer regions (blue) or promoter regions (red). All TFs were studied collectively by rank normalization of their heterotypic CCL-score. c Occupancy differences between high and low co-localization sites for individual TFs. For each lymphoblastoid TF, the fractional increase in binding site occupancy when comparing the top and bottom terciles of CCL-scores is shown as a bar plot. Stars denote significance level (FDR-adjusted p value for a G-test with Williams’ correction). d Dissecting the homotypic TF occupancy to Hi-C relationship according to strong and weak sequence motifs. As in a, but sub-divided according to promoter or enhancer classes (see the “Methods” section) with either strong (left) or weak (right) DNA sequence motifs, based on motif p values obtained from FIMO motif scans [70]. e Dissecting the homotypic TF occupancy to Hi-C relationship according to promoter expression. As in a, but with gene promoter regions classified according to strength of RNA-seq signal. Accessible sites for different TFs were rank normalized, combined and grouped into ten bins according to CCL-score. Pearson’s R2 values are shown alongside the percentage change in occupancy change across the CCL range. Error bars indicate standard deviation from resampling. f Relating spatial and 1D sequence densities of TF sites in mESC genome structures. The color matrix shows the distribution, for all mESC TFs combined, of the spatial density enrichment (SDE) at different rank-normalized sequence densities. Line plots represent mean values for the distribution of SDE across decile groups of sequential TF density and either represent all TF sites (yellow), enhancers (blue), or promoters (red). Error bars represent standard error of the mean and triangles the 25–75th percentiles. Data shown is for homotypic sites, aggregated for all mESC TFs studied
Fig. 3
Fig. 3
Identification of heterotypic TF co-localization groups. a Co-localization enrichment between different TFs in human GM12878 cells. CE values between different lymphoblastoid TF pairs are shown as a color matrix. Colors indicate CE value, where red or blue represents higher or lower than expected contact frequency respectively. Ward’s method [79], using the distance measure in Eq. 5, was used to define row and column orders. Alternative clustering, using Euclidean distances with Wards’ method, is shown in Additional file 2: Figure S4a. The two major sub-network groups that become apparent are labelled at the left. b Co-localization enrichment between different TFs in mESC genome structures. Structural proximity enrichment (PE) values between the different mESC TF pairs are shown as a color matrix. Colors indicate PE values; enrichment/depletion of spatially co-localized binding sites compared to the random expectation, where red or blue represents higher or lower than expected co-localization respectively. Data is shown for the six best-defined structures in Stevens et al. [36] combined. Row and column order was determined by using hierarchical clustering based on Wards’ method. The two major sub-network groups that become apparent are labelled at the left. c 3D genome distributions of group 1/2 TF sites. Locations of TF binding sites in group 1 and group 2 are shown as purple and green circles respectively and superimposed upon a thin section of a whole genome structure (left). The same view is also shown with the A and B chromosome compartments colored red and blue respectively (right). The data shown is “Cell1” from Stevens et al. [36]; modelled at 100-kb particle resolution using single-cell Hi-C contacts from mESCs. d 3D distributions of group 1/2 sites in Chr4 and Chr9. Chromosomes 4 and 9 shown in isolation, taken from the structure shown in c. TF binding sites in the group 1 and group 2 groups are shown as green and purple circles respectively
Fig. 4
Fig. 4
Analysis of heterotypic TF pairs and TF network groups. a Top ranked co-localized heterotypic TF pairs. The top 20 highly co-localized heterotypic TF pairs identified Hi-C contact maps for GM12878 lymphoblastoid cells (left) and single-cell Hi-C genome structures of mESCs (right). Pairs are ranked by deviation above the random expectation, as described in the “Methods” section. Asterisks represent TF pairings previously identified in the literature and a double asterisk specifically in Wang et al. [89]. See Additional file 1: Table S3 and Table S4 for full ranked lists of scores and significance values. b Enrichment of TFs in chromosome compartments. Fractions of TF binding sites in the A1 sub-compartment (lymphoblastoid cells, left) or A compartment (mESCs, right) compared to the total in A1 + A1 or A + B, respectively. TFs are shown in the hierarchical cluster order of Fig. 3. c Conservation of TF epigenetic marks between GM12878 and h1-ESC. For various histone mark profiles or DHS profiles, each point represents the proportion of binding sites, genome-wide for each TF, that have a consistent profile between GM12878 and human ESCs. TFs are separated and color-coded according to sub-network group 1 (blue), group 2 (red) or otherwise ungrouped (yellow). d Sequence separations of lymphoblastoid TF sites to TSS and CTCF sites. Cumulative distributions of absolute sequence separations from lymphoblastoid TF binding sites to TSSs (left) and CTCF binding sites (right) are shown as line plots, with one line for each TF. Ranked data is cumulatively summed and presented as a proportion of the total. The lines are color coded according to whether the TF is found in group 1 (blue), group 2 (red), or otherwise ungrouped (yellow). p values were calculated between TF groups using the Wilcoxon ranked-sum test on the mean absolute deviation of signed sequence separations (i.e., either side of the TF site, rather than the absolute values used in the cumulative plots) to TSS and CTCF sites. e Sequence separations of mESC TF sites to TSS and CTCF sites. As in d, but for mESC TFs: the distributions of sequence separations from mESC TF binding sites to TSS (left) and CTCF binding sites (right). The data shown is for TFs; the CTCF and cohesin components are not included
Fig. 5
Fig. 5
Relationships between heterotypic TF site occupancy and co-localization within and between sub-networks. a Relating TF binding site occupancy to the co-localization within proximity sub-networks. Scatter plots with regression lines, separated according to promoter (red) and enhancer (blue) regions, showing the relationship between the mean TF site occupancy and heterotypic co-localization (i.e., between different TF types) within the same co-localization group as measured by CCL-score. Average values for all sites in each of the groups is shown in grey. Binding sites for TFs are rank normalized and grouped into deciles according to the integrated heterotypic CCL-scores within each group. Data is shown separately for TFs from group 1 (left) and group 2 (right). b Relating TF binding site occupancy to the co-localization between group 1 and group 2. Similar to a, but showing the site occupancy of TFs from one sub-network compared to their co-localization with TFs from the other sub-network. c Occupancy differences for high and low TF site co-localization, within and between sub-networks for individual TFs. For each TF within group 1 (top) or group 2 (bottom), the fractional difference in binding site occupancy between the top and the bottom third of CCL-scores plotted as a bar chart. Data is separated into homotypic, intra-, and inter-sub-network co-localization groups. Yellow bars correspond to integrated group 1 CCL-scores, while blue bars correspond to the equivalent measure for group 2; thus, for TFs within group 1, yellow bars represent intra-group co-localization; while for TFs within group 2, blue bars are for intra-sub-network. The effect of homotypic binding site co-localization is also plotted for comparison. The presence of the star above each bar indicates statistical significance (chi-square test with Yates’ correction, p < 0.01)
Fig. 6
Fig. 6
A graphical overview showing the major findings of this study. a Measures relating TF presence at binding sites to spatial co-localization. Using Hi-C contacts and single-cell genome structures, our study has shown that, in general, homotypic TF binding site co-localization increases as (i) the bound fraction of binding sites (occupancy) increases, (ii) as the detected ChIP-seq signal for TF sites increases, and (iii) as the linear density of TF sites increases. Also, we observe that these trends are stronger for sequentially distal (i.e., enhancer) and weaker regulatory sites. b Grouping of transcription factors into proximity sub-networks. Measuring the degree of co-localization between different TFs, compared to a random background expectation, shows that TFs in both human lymphoblastoid cells and mouse ESCs can be grouped into distinct proximity sub-networks, which appear to correspond to differences in chromatin context and lineage specificity. Furthermore, comparing TF co-localization within and between sub-networks suggests that there is a degree of spatial segregation in TF binding relating to these groups

Similar articles

Cited by

References

    1. Arvey A, Agius P, Noble WS, Leslie C. Sequence and chromatin determinants of cell-type-specific transcription factor binding. Genome Res. 2012;22:1723–1734. doi: 10.1101/gr.127712.111. - DOI - PMC - PubMed
    1. Farnham PJ. Insights from genomic profiling of transcription factors. Nat Rev Genet. 2009;10:605–616. doi: 10.1038/nrg2636. - DOI - PMC - PubMed
    1. Veerla S, Ringnér M, Höglund M. Genome-wide transcription factor binding site/promoter databases for the analysis of gene sets and co-occurrence of transcription factor binding motifs. BMC Genomics. 2010;11:145. doi: 10.1186/1471-2164-11-145. - DOI - PMC - PubMed
    1. Li X, MacArthur S, Bourgon R, Nix D, Pollard DA, Iyer VN, et al. Transcription factors bind thousands of active and inactive regions in the Drosophila blastoderm. PLoS Biol. 2008;6:e27. doi: 10.1371/journal.pbio.0060027. - DOI - PMC - PubMed
    1. Kim HD, O’Shea EK. A quantitative model of transcription factor-activated gene expression. Nat Struct Mol Biol. 2008;15:1192–1198. doi: 10.1038/nsmb.1500. - DOI - PMC - PubMed

Publication types

LinkOut - more resources