. 2019 Jan;597(2):583-597.
doi: 10.1113/JP276768. Epub 2018 Nov 24.

Developmental maturation of activity-induced K+ and pH transients and the associated extracellular space dynamics in the rat hippocampus

Affiliations

Developmental maturation of activity-induced K+ and pH transients and the associated extracellular space dynamics in the rat hippocampus

Brian Roland Larsen et al. J Physiol. 2019 Jan.

Abstract

Key points: Neuronal activity induces fluctuation in extracellular space volume, [K+ ]o and pHo , the management of which influences neuronal function The neighbour astrocytes buffer the K+ and pH and swell during the process, causing shrinkage of the extracellular space In the present study, we report the developmental rise of the homeostatic control of the extracellular space dynamics, for which regulation becomes tighter with maturation and thus is proposed to ensure efficient synaptic transmission in the mature animals The extracellular space dynamics of volume, [K+ ]o and pHo evolve independently with developmental maturation and, although all of them are inextricably tied to neuronal activity, they do not couple directly.

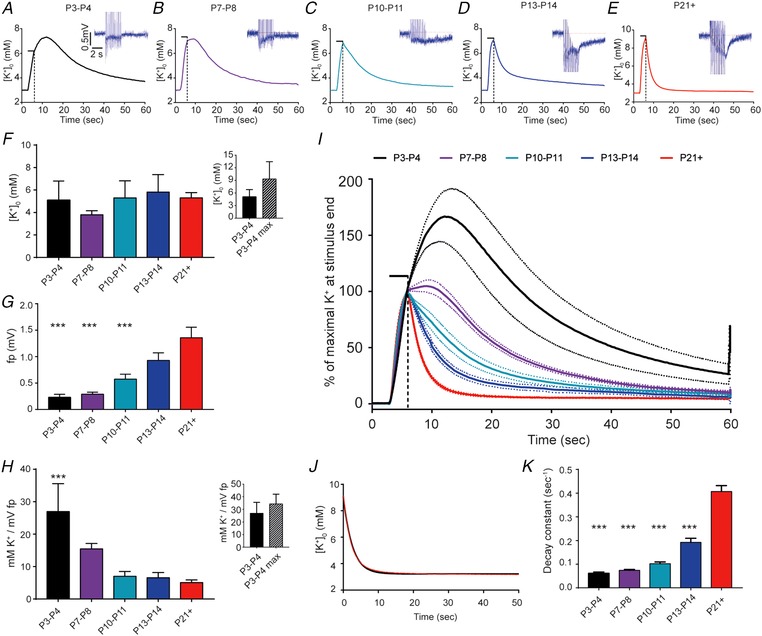
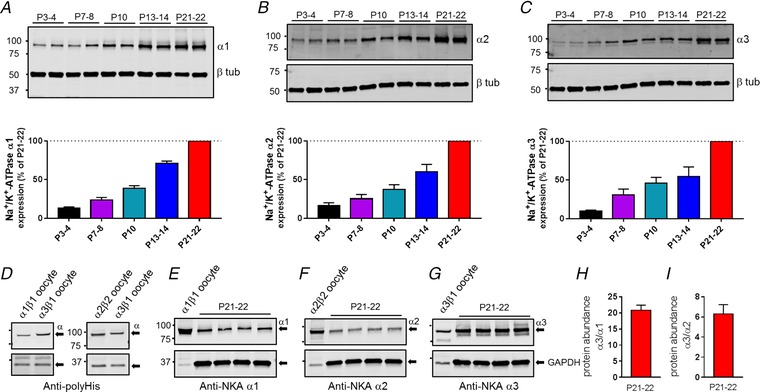
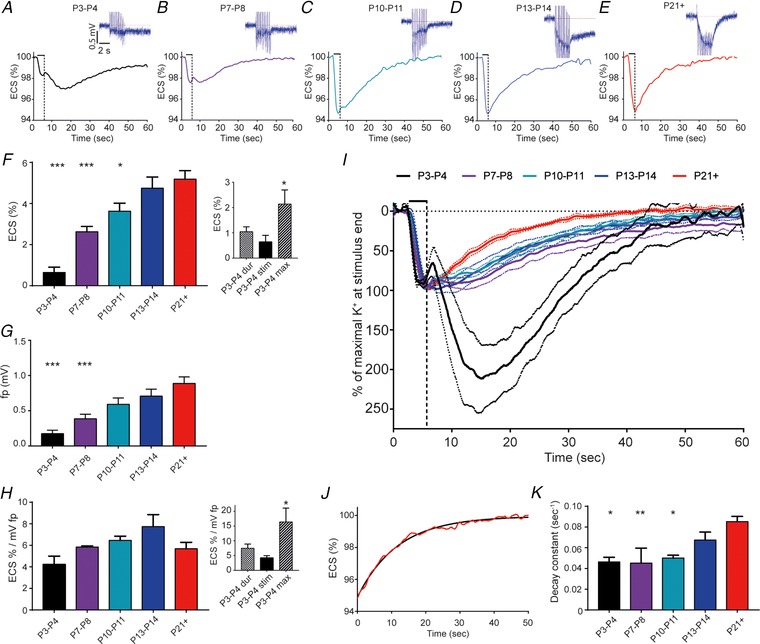
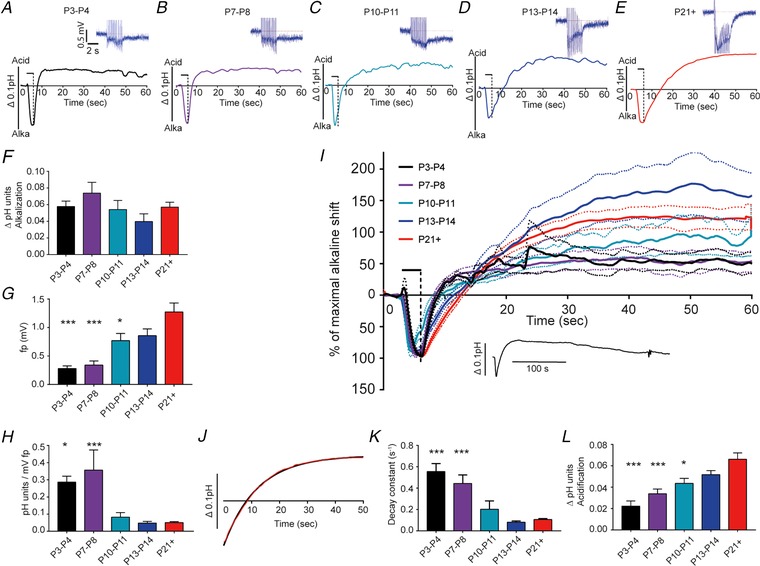
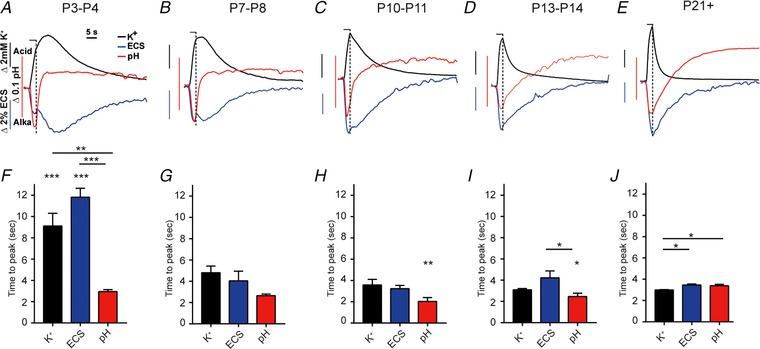
Abstract: Neuronal activity in the mammalian central nervous system associates with transient extracellular space (ECS) dynamics involving elevated K+ and pH and shrinkage of the ECS. These ECS properties affect membrane potentials, neurotransmitter concentrations and protein function and are thus anticipated to be under tight regulatory control. It remains unresolved to what extent these ECS dynamics are developmentally regulated as synaptic precision arises and whether they are directly or indirectly coupled. To resolve the development of homeostatic control of [K+ ]o , pH, and ECS and their interaction, we utilized ion-sensitive microelectrodes in electrically stimulated rat hippocampal slices from rats of different developmental stages (postnatal days 3-28). With the employed stimulation paradigm, the stimulus-evoked peak [K+ ]o and pHo transients were stable across age groups, until normalized to neuronal activity (field potential amplitude), in which case the K+ and pH shifted significantly more in the younger animals. By contrast, ECS dynamics increased with age until normalized to the field potential, and thus correlated with neuronal activity. With age, the animals not only managed the peak [K+ ]o better, but also displayed swifter post-stimulus removal of [K+ ]o , in correlation with the increased expression of the α1-3 isoforms of the Na+ /K+ -ATPase, and a swifter return of ECS volume. The different ECS dynamics approached a near-identical temporal pattern in the more mature animals. In conclusion, although these phenomena are inextricably tied to neuronal activity, our data suggest that they do not couple directly.

Keywords: Extracellular space dynamics; K+ homeostasis; Na+/K+-ATPase; astrocytes; pH transients.


Figures

Figure 1
Figure 1. Development of K+ regulation in rats
Ion‐sensitive microelectrodes were utilized to record the extracellular K+ concentration, and the corresponding field potential, in electrically stimulated hippocampal slices from rats of various age groups. AE, representative traces of stimulus‐evoked changes in [K+]o for the different age groups tested; P3–P4 (A), P7–P8 (B), P10–P11 (C), P13–P14 (D) and P21+ (E), with representative field potentials as inserts. F, summarized data of the peak amplitude at the end of stimulation for the respective age groups (in mm) P3–P4: 5.1 ± 1.7; P7–P8: 3.8 ± 0.4; P10–P11: 5.3 ± 1.5; P13–P14: 5.8 ± 1.6; P21+: 5.3 ± 0.5. Insert: peak amplitude of P3‐P4 at stimulus end and at the time of the maximal amplitude (9.3 ± 4.1 mm). G, summarized data of the amplitude of the field potential for the different age groups (in mV) P3–P4: 0.23 ± 0.05; P7–P8: 0.29 ± 0.04; P10–P11: 0.58 ± 0.09; P13–P14: 0.93 ± 0.14; P21+: 1.4 ± 0.20. H, peak [K+]o amplitude at stimulus end was normalized to the corresponding field potential in each experiment and summarized (in mm/mV) P3–P4: 27.0 ± 8.6; P7–P8: 15.4 ± 1.7; P10–P11: 7.0 ± 1.5; P13–P14: 6.6 ± 1.6; P21+: 5.1 ± 0.80. Insert includes the maximal peak amplitude of P3–P4 normalized to the field potential (34.3 ± 7.8 mm/mV). I, single individual recordings were normalized to the K+ amplitude at the end of stimulus and illustrated as the average (full line) and standard errors (dashed lines) within the age group allowing for direct comparison of their shape. J, representative example of fitting the return to baseline using a one‐phase decay equation (black line) on a K+ recording (red) from a P21 rat. K, comparison of the decay constant between the age groups (calculated from the individual recordings, in s−1): P3–P4: 0.06 ± 0.01; P7–P8: 0.07 ± 0.01; P10–P11: 0.10 ± 0.01; P13–P14: 0.19 ± 0.02; P21+: 0.41 ± 0.02. The black bar above the respective traces represents 20 Hz stimulation. The number of experiments performed: P3–P4 (n = 6 slices from six animals); P7–P8 (n = 9 slices from nine animals); P10–P11 (n = 6 slices from six animals); P13–P14 (n = 7 slices from six animals); P21+ (n = 7 slices from four animals). Statistical significance was tested with one‐way ANOVA with Dunnett's multiple comparison post hoc test and the asterisks refer to significant differences to the P21+ age group or with Student's paired t test (insert in F and H). *** P < 0.001.
Figure 2
Figure 2. Na+/K+‐ATPase subunit expression
Representative western blots showing the protein expression of Na+/K+‐ATPase isoforms α1 (A), α2 (B) and α3 (C) across five different developmental time points of the rat hippocampus (upper). Lower: quantification and normalization of the signals to the values at age P21+. For semi‐quantitative comparison of isoforms α1, α2 and α3, polyhistidine‐tagged versions expressed in Xenopus oocytes were probed with an anti‐polyhistidine antibody (D) and with isoform‐specific antibodies (E, F and G, left lanes). The ratios of the thus detected signals were used to quantify Na+/K+‐ATPase α1, α2,and α3 in P21+ rat hippocampal lysates (E, F and G). H, quantification of Na+/K+‐ATPase α3 relative to α1. I, quantification of Na+/K+‐ATPase α3 relative to α2 (n = 4 for all experiments). β tubulin and GAPDH was used as loading controls.
Figure 3
Figure 3. Development of ECS shrinkage dynamics in rats
Ion‐sensitive microelectrodes were employed to record the ECS changes (as well as the associated field potential), in electrically stimulated hippocampal slices from rats of various age groups. AE, representative traces of stimulus‐evoked changes in ECS for the different age groups tested. P3–P4 (A), P7–P8 (B), P10–P11 (C), P13–P14 (D) and P21+ (E). Inserts show representative field potentials. F, summarized data of the peak ECS change at the end of stimulation for the respective age groups (as a percentage) P3–P4: 0.65 ± 0.26; P7–P8: 2.63 ± 0.26; P10–P11: 3.63 ± 0.39; P13–P14: 4.75 ± 0.55; P21+: 5.19 ± 0.41. Insert: P3–P4 ECS changes during the stimulation (‘dur’, 1.04 ± 0.19%), at the end of the stimulation (‘stim’), and at the maximum (‘max’, 2.12 ± 0.56%). G, summarized data showing the amplitude of the field potential for the respective age groups (in mV) P3–P4: 0.18 ± 0.05; P7–P8: 0.39 ± 0.06; P10–P11: 0.59 ± 0.09; P13–P14: 0.71 ± 0.10; P21+: 0.9 ± 0.09. H, ECS amplitude was normalized to the corresponding field potential in each experiment and summarized (as a percentage/mV) P3–P4: 4.22 ± 0.78; P7–P8: 5.84 ± 0.10; P10–P11: 6.46 ± 0.40; P13–P14: 7.73 ± 1.11; P21+: 5.68 ± 0.59. Insert illustrates the normalized P3–P4 ECS changes during the stimulation (7.46 ± 1.45%/mV), at the end of the stimulation, and at the maximum (16.4 ± 4.67%/mV). I, single individual recordings were normalized to the ECS change at the end of stimulus, summarized (full line, standard error illustrated as dashed line) for each age group, allowing for direct comparison of their shape. J, representative example of fitting the return to baseline using a one‐phase decay equation (black line) on an ECS recording (red) from a P22 rat. K, comparison of the decay constant calculated from the maximal peak between the age groups (calculated from the individual recordings, in s−1): P3–P4: 0.048 ± 0.004; P7–P8: 0.047 ± 0.015; P10–P11: 0.052 ± 0.003; P13–P14: 0.069 ± 0.008; P21+: 0.087 ± 0.005. The black bar above the respective traces represents 20 Hz stimulation. The number of experiments performed: P3–P4 (n = 5 slices from five animals), P7–P8 (n = 7 slices from seven animals), P10–P11 (n = 6 slices from six animals), P13–P14 (n = 8 slices from eight animals), P21+ (n = 8 from seven animals). Statistical significance was tested with one‐way ANOVA with Dunnett's multiple comparison post hoc test and the asterisks refer to significant differences to the P21+ age group (or to stimulus end inserts in F–G). * P < 0.05, ** P < 0.01, *** P < 0.001.
Figure 4
Figure 4. Development of extracellular pH transients in rats
Ion‐sensitive microelectrodes were employed to record the pH shifts and the corresponding field potential, in electrically stimulated hippocampal slices from rats of various age groups. AE, representative recordings of stimulus‐evoked shifts in pH for the different age groups tested. P3–P4 (A), P7–P8 (B), P10–P11 (C), P13–P14 (D) and P21+ (E). Inserts show representative field potentials. F, summarized data of the peak alkaline shift for the respective age groups (in pH units) P3–P4: 0.058 ± 0.006; P7–P8: 0.074 ± 0.013; P10–P11: 0.054 ± 0.011; P13–P14: 0.040 ± 0.009; P21+: 0.057 ± 0.006. G, summarized data showing the amplitude of the field potential for the respective age groups (in mV) P3–P4: 0.28 ± 0.05; P7–P8: 0.34 ± 0.07; P10–P11: 0.77 ± 0.13; P13–P14: 0.86 ± 0.12; P21+: 1.3 ± 0.16. H, amplitude in pH of the alkaline shift was normalized to the corresponding field potential in each experiment and summarized (in pH/mV) P3–P4: 0.103 ± 0.030; P7–P8: 0.142 ± 0.044; P10–P11: 0.063 ± 0.012; P13–P14: 0.067 ± 0.009; P21+: 0.059 ± 0.006. I, single individual recordings were normalized to the maximal alkaline shift and summarized (full line with the standard errors illustrated as dashed lines) for each age group, allowing for direct comparison of their shape. Insert shows a longer recording from a P27 rat indicating the time it takes for the pH to fully recover following a stimulation train. J, representative example of fitting the return pH using a one‐phase decay equation (black line) on a pH recording (red) from a P27 rat. K, comparison of the decay constant between the age groups (calculated from the individual recordings, in s−1): P3–P4: 0.56 ± 0.07; P7–P8: 0.44 ± 0.08; P10–P11: 0.20 ± 0.08; P13–P14: 0.08 ± 0.01; P21+: 0.11 ± 0.01. L, summarized data of the maximal acidic shift relative to the initial baseline for the respective age groups (in pH units) P3–P4: 0.022 ± 0.005; P7–P8: 0.034 ± 0.004; P10–P11: 0.044 ± 0.005; P13–P14: 0.052 ± 0.004; P21+: 0.066 ± 0.006. The black bar above the respective traces represents 20 Hz stimulation. The number of experiments performed: P3–P4 (n = 5 slices from five animals), P7–P8 (n = 6 from six animals), P10–P11 (n = 5 from five animals), P13–P14 (n = 7 from seven animals); P21+ (n = 9 from six animals). Statistical significance was tested with one‐way ANOVA with Dunnett's multiple comparison post hoc test and the asterisks refer to significant differences to the P21+ age group. * P < 0.05, *** P < 0.001.
Figure 5
Figure 5. Comparison of the temporal aspect in the ionic transients
The data are a re‐representation of the data acquired in Figs 1, 3 and 5, with the goal to analyse the time course of the ionic shifts. AE, representative comparison of the different ionic transients (K+, ECS, pH) for the different age groups. The black bar above the respective traces represents 20 Hz stimulation. FJ, summarized data of the time to reach the maximal response following the initiation of stimulation (in s). P3–P4: K+: 9.1 ± 1.2, ECS: 11.8 ± 0.8, pH: 3.0 ± 0.2; P7–P8: K+: 4.8 ± 0.6, ECS: 4.0 ± 0.9, pH: 2.6 ± 0.1; P10–P11: K+: 3.5 ± 0.5, ECS: 3.2 ± 0.3, pH: 2.0 ± 0.4; P13–P14: K+: 3.1 ± 0.1, ECS: 4.2 ± 0.7, pH: 2.5 ± 0.3; P21+: K+: 3.0 ± 0.04, ECS: 3.5 ± 0.1, pH: 3.4 ± 0.1. The number of experiments can be found in the legends of Figs 1, 3 and 5. Statistical significance was tested with one‐way ANOVA with Tukey's multiple comparison post hoc test, when comparing within the age groups, and with Dunnett's multiple comparison post hoc test when comparing between the age groups for each individual ion. The asterisks above the histograms refer to significant differences to the P21+ age group (Dunnett's), while asterisks above lines indicate comparisons between the indicated bars (Tukey's). * P < 0.05, ** P < 0.01, *** P < 0.001.

Similar articles

Cited by

References

    1. Ballanyi K, Grafe P, Reddy MM & Ten Bruggencate G (1984). Different types of potassium transport linked to carbachol and γ‐aminobutyric acid actions in rat sympathetic neurons. Neuroscience 12, 917–927. - PubMed
    1. Ballanyi K, Grafe P & ten Bruggencate G (1987). Ion activities and potassium uptake mechanisms of glial cells in guinea‐pig olfactory cortex slices. J Physiol 382, 159–174. - PMC - PubMed
    1. Bondareff W & Pysh JJ (1968). Distribution of the extracellular space during postnatal maturation of rat cerebral cortex. Anat Rec 160, 773–780. - PubMed
    1. Brown AM & Ransom BR (2015). Astrocyte glycogen as an emergency fuel under conditions of glucose deprivation or intense neural activity. Metab Brain Dis 30, 233–239. - PubMed
    1. Catania MV, Landwehrmeyer GB, Testa CM, Standaert DG, Penney JB & Young AB (1994). Metabotropic glutamate receptors are differentially regulated during development. Neuroscience 61, 481–495. - PubMed

Publication types