. 2019 Jan 4;93(2):e01593-18.
doi: 10.1128/JVI.01593-18. Print 2019 Jan 15.

A Genome-Wide Epstein-Barr Virus Polyadenylation Map and Its Antisense RNA to EBNA

Affiliations

A Genome-Wide Epstein-Barr Virus Polyadenylation Map and Its Antisense RNA to EBNA

Vladimir Majerciak et al. J Virol. .

Abstract

Epstein-Barr virus (EBV) is a ubiquitous human pathogen associated with Burkitt's lymphoma and nasopharyngeal carcinoma. Although the EBV genome harbors more than a hundred genes, a full transcription map with EBV polyadenylation profiles remains unknown. To elucidate the 3' ends of all EBV transcripts genome-wide, we performed the first comprehensive analysis of viral polyadenylation sites (pA sites) using our previously reported polyadenylation sequencing (PA-seq) technology. We identified that EBV utilizes a total of 62 pA sites in JSC-1, 60 in Raji, and 53 in Akata cells for the expression of EBV genes from both plus and minus DNA strands; 42 of these pA sites are commonly used in all three cell lines. The majority of identified pA sites were mapped to the intergenic regions downstream of previously annotated EBV open reading frames (ORFs) and viral promoters. pA sites lacking an association with any known EBV genes were also identified, mostly for the minus DNA strand within the EBNA locus, a major locus responsible for maintenance of viral latency and cell transformation. The expression of these novel antisense transcripts to EBNA were verified by 3' rapid amplification of cDNA ends (RACE) and Northern blot analyses in several EBV-positive (EBV+) cell lines. In contrast to EBNA RNA expressed during latency, expression of EBNA-antisense transcripts, which is restricted in latent cells, can be significantly induced by viral lytic infection, suggesting potential regulation of viral gene expression by EBNA-antisense transcription during lytic EBV infection. Our data provide the first evidence that EBV has an unrecognized mechanism that regulates EBV reactivation from latency.IMPORTANCE Epstein-Barr virus represents an important human pathogen with an etiological role in the development of several cancers. By elucidation of a genome-wide polyadenylation landscape of EBV in JSC-1, Raji, and Akata cells, we have redefined the EBV transcriptome and mapped individual polymerase II (Pol II) transcripts of viral genes to each one of the mapped pA sites at single-nucleotide resolution as well as the depth of expression. By unveiling a new class of viral lytic RNA transcripts antisense to latent EBNAs, we provide a novel mechanism of how EBV might control the expression of viral latent genes and lytic infection. Thus, this report takes another step closer to understanding EBV gene structure and expression and paves a new path for antiviral approaches.

Keywords: Epstein-Barr virus; RNA-seq; antisense RNA; genome-wide approach; polyadenylation site mapping; tumor virus.


Figures

FIG 1
FIG 1
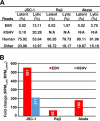
EBV expression in JSC-1, Raji, and Akata cells. (A) Percentage of total reads uniquely mapped to the EBV reference genome (GenBank accession no. NC_007605), the KSHV genome (GenBank accession no. U75698), and human (hg19) reference genomes in PA-seq libraries constructed from JSC-1, Raji, and Akata cells with latent or lytic infection. N/A, not applicable. (B) Simultaneous reactivation of lytic KSHV and EBV infection in JSC-1 cells and EBV lytic infection in Raji and Akata cells followed by lytic reactivation. The level of virus reactivation was determined by the fold change of virus-specific reads between lytic and latent libraries after normalization to the total library size in millions (RPM, reads per million).
FIG 2
FIG 2
Distribution of PA-seq reads on the linear reference EBV genome. The PA-seq reads from JSC-1 cells without (latent) or with (lytic) butyrate treatment were aligned to the reference EBV genome (GenBank accession no. NC_007605). The nucleotide positions and frequencies of all mapped pA reads in the plus (+) and minus (−) strands of the double-stranded EBV genome (A) or the selected genome regions (B) in latent (blue bars) or lytic (red bars) samples were visualized using IGV software. The scale was set to a maximum of 200 reads.
FIG 3
FIG 3
Genome-wide distributions of the mapped pA sites in the context of the EBV reference genome (GenBank accession no. NC_007605). All EBV pA sites identified by PA-seq in at least one cell line with a frequency of >50 reads are shown in panel A, with a blue or red triangle representing the mapped pA site at a nucleotide position by number from either the plus DNA strand (+) (blue) or the minus DNA strand (−) (red) at the EBV genome. Dark (plus strand) and light green (minus strand) arrows or boxes stand for the lytic gene transcripts, black arrows and boxes indicate the latent gene transcripts, and orange bars or arrows indicate the noncoding small RNA transcripts. The reported promoter positions based on the EBV B95-8 genome (GenBank accession no. V01555) are shown as black arrows according to CAGE-seq analysis of EBV p2089 bacterial artificial chromosome (BAC)mid-infected HEK293 cells (40) after being realigned to the reference EBV genome (GenBank accession no. NC_007605). (B) Cell line-specific use of EBV pA sites. The Venn diagram shows the number of pA sites used in each EBV genome.
FIG 4
FIG 4
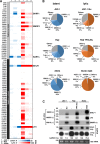
Kinetics of EBV gene expressions according to pA site usage. (A and B) Relative expression levels of the annotated viral genes associated with each mapped pA site during EBV latent and lytic infection in individual cell lines. (A) Heat map by color scale showing the gene expression abundance according to the mapped pA site usage in each cell line during latent (blue scale) and lytic (red scale) infection. Numbers on the left are nucleotide positions of the mapped pA sites in the plus (+) or minus (−) strand of the EBV genome. On the right are the representative genes using the mapped pA site. (B) The top five most-used pA sites in latent (blue pies) or lytic (orange pies) EBV infection in each cell line. The pie charts show the percentages of all PA-seq reads mapped to the top five most-used pA sites, with “Others” representing the percentage of combined reads mapped to all remaining pA sites (see details in Table S1 in the supplemental material). (C) Expression of the gene transcripts associated with the three most-used pA sites. Northern blot analysis using a probe derived from the BHLF1 (oVM417), LF3 (oVM418), BMRF1/2 (oVM377), or GAPDH (oZMZ70) gene was performed on total RNA isolated from each cell line with latent (−) or lytic infection induced by butyrate (Bu), 12-O-tetradecanoylphorbol-13-acetate (TPA), or anti-human serum (αIgG). GAPDH RNA and ethidium bromide-stained 18S rRNA served as RNA sample loading controls.
FIG 5
FIG 5
Regulatory elements of mapped pA sites in the EBV genome. (A) Conservation of the cis regulatory elements surrounding EBV pA sites. The sequence logo was generated from DNA sequences ±50 nt from each pA site using WebLogo (http://weblogo.berkeley.edu/logo.cgi). PAS, polyadenylation signal; CS, cleavage site; DSE, distal sequence element. (B) Roles of polyadenylation signals in EBV expression. Numbers in each pie chart are the frequencies (percent) of PAS variants (canonical, noncanonical, or no detectable PAS) calculated for all pA sites (see Table S1 in the supplemental material).
FIG 6
FIG 6
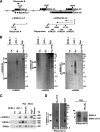
Experimental validation of selected pA sites. (A) Diagram showing the gene structures of LMP-2A/2B and BART transcript loci and the nucleotide positions of the identified pA sites (blue triangles). 3′ RACE was carried out on total RNA from lytically induced JSC-1, Raji, and Akata cells using gene-specific primers (black thick arrows); the RACE products were separated by agarose gel electrophoresis. (B) The identity of the resulting RACE product (A) was determined by Sanger sequencing after TA cloning.
FIG 7
FIG 7
Polyadenylation of multiple viral transcripts at a single pA site. Shown are diagrams of the selected gene loci (A, B, C and D) containing multiple colinear genes of which their RNA transcripts are terminated at a common poly(A) site at a specific nucleotide position (triangles in red for antisense transcripts and in blue for sense transcripts). Arrows below the diagram are specific antisense oligonucleotide probes used in Northern blot analyses. The Northern blot gel below each gene cluster region (A, B, C, or D) shows the detected transcripts, as indicated by small black arrows, from this cluster region. A total of ∼5 μg of total RNA from JSC-1 cells with latent (minus butyrate [Bu]) or lytic (plus Bu) EBV infection was used for Northern blot analysis.
FIG 8
FIG 8
Identification of the EBNA-antisense transcripts in EBV+ cell lines by 3′ RACE. (A) Diagram showing various parts of the EBNA loci with the mapped pA sites in the plus strand (blue triangles) and the minus strand (red triangles). Hypothetical antisense transcripts (dashed red arrows) transcribed from an unknown (?) promoter are shown in association with each mapped pA site in the minus strand. Black arrows represent DNA oligonucleotides that were used for 3′ RACE. (B) Agarose gel images showing that the detection of 3′ RACE products was carried out with 1 μg of total RNA each from lytic JSC-1, Raji, and Akata cells induced by 48 h of treatment with the corresponding inducers. *, nonspecific products. (C) Sequencing results for each 3′ RACE product from JSC-1 cells. The RACE product was gel purified, and the mapped pA site (cleavage site) for RNA polyadenylation was confirmed by Sanger sequencing.
FIG 9
FIG 9
Northern blot analysis of antisense transcripts to EBNA-3B and -3C and EBNA-2. (A) Schematic diagram of the EBNA loci with the identified pA sites in the plus and minus strands (black triangles with nucleotide positions). The dashed arrows to the left represent the predicted transcripts antisense to various EBNA transcripts, with an unknown (?) promoter. Solid thick arrows to the right, below the diagram, point to riboprobe A or oligonucleotide probes in the sense orientation for detection of the antisense transcripts, or those to the left, above the diagram, point to riboprobe B in the antisense orientation for detection of the EBNA-2 transcript by Northern blotting. (B) Autoradiograms of the antisense EBNA-3 transcripts detected by 32P-labeled sense oligonucleotide probes in Northern blots using the poly(A)-selected RNA from BCBL-1 (KSHV+/EBV-negative), JSC-1, or Raji cells with or without (−) 48 h of treatment with the indicated chemicals. (C) Detection of EBNA-2 and antisense EBNA-2 transcripts by 3′ RACE analyses. Poly(A)-selected RNA from BCBL-1, JSC-1, Raji, and Akata cells with or without (−) lytic EBV induction by the indicated chemicals for 48 h was used for 3′ RACE analyses with an antisense DNA oligonucleotide, oVM285 (Fig. 8A), for detection of antisense EBNA-2 and a sense DNA oligonucleotide, oVM232 (see Table S3 in the supplemental material), for detection of the EBNA-2 transcript. Detection of the EBV RPMS1/BART miRNA transcripts using a sense DNA oligonucleotide, oVM283, served as a control. The products were resolved by agarose gel electrophoresis. (D) Northern blot detection of the transcripts antisense to EBNA-2 and EBNA-2 mRNAs. Poly(A)-selected RNA from Raji and Akata cells with or without (−) lytic EBV infection was used for the analyses with riboprobe A for detection of the antisense transcript to EBNA-2 from Raji and Akata cells (left) or riboprobe B for detection of the EBNA-2 transcripts from Raji cells (right). ?, hypothetical EBNA-LP RNA products.

Similar articles

Cited by

References

    1. Babcock GJ, Decker LL, Volk M, Thorley-Lawson DA. 1998. EBV persistence in memory B cells in vivo. Immunity 9:395–404. doi:10.1016/S1074-7613(00)80622-6. - DOI - PubMed
    1. Cohen JI. 2000. Epstein-Barr virus infection. N Engl J Med 343:481–492. doi:10.1056/NEJM200008173430707. - DOI - PubMed
    1. Ok CY, Li L, Young KH. 2015. EBV-driven B-cell lymphoproliferative disorders: from biology, classification and differential diagnosis to clinical management. Exp Mol Med 47:e132. doi:10.1038/emm.2014.82. - DOI - PMC - PubMed
    1. Bass AJ, Thorsson V, Shmulevich I, Reynolds SM, Miller M, Bernard B, Hinoue T, Laird PW, Curtis C, Shen H, Weisenberger DJ, Schultz N, Shen R, Weinhold N, Kelsen DP, Bowlby R, Chu A, Kasaian K, Mungall AJ, Gordon Robertson A, Sipahimalani P, Cherniack A, Getz G, Liu Y, Noble MS, Pedamallu C, Sougnez C, Taylor-Weiner A, Akbani R, Lee J-S, Liu W, Mills GB, Yang D, Zhang W, Pantazi A, Parfenov M, Gulley M, Blanca Piazuelo M, Schneider BG, Kim J, Boussioutas A, Sheth M, Demchok JA, Rabkin CS, Willis JE, Ng S, Garman K, Beer DG, Pennathur A, Raphael BJ, et al. 2014. Comprehensive molecular characterization of gastric adenocarcinoma. Nature 513:202–209. doi:10.1038/nature13480. - DOI - PMC - PubMed
    1. Kang MS, Kieff E. 2015. Epstein-Barr virus latent genes. Exp Mol Med 47:e131. doi:10.1038/emm.2014.84. - DOI - PMC - PubMed

Publication types

LinkOut - more resources