. 2018 Nov 5;215(11):2936-2954.
doi: 10.1084/jem.20181210. Epub 2018 Oct 24.

Peyer's patch myeloid cells infection by Listeria signals through gp38+ stromal cells and locks intestinal villus invasion

Affiliations

Peyer's patch myeloid cells infection by Listeria signals through gp38+ stromal cells and locks intestinal villus invasion

Olivier Disson et al. J Exp Med. .

Abstract

The foodborne pathogen Listeria monocytogenes (Lm) crosses the intestinal villus epithelium via goblet cells (GCs) upon the interaction of Lm surface protein InlA with its receptor E-cadherin. Here, we show that Lm infection accelerates intestinal villus epithelium renewal while decreasing the number of GCs expressing luminally accessible E-cadherin, thereby locking Lm portal of entry. This novel innate immune response to an enteropathogen is triggered by the infection of Peyer's patch CX3CR1+ cells and the ensuing production of IL-23. It requires STAT3 phosphorylation in epithelial cells in response to IL-22 and IL-11 expressed by lamina propria gp38+ stromal cells. Lm-induced IFN-γ signaling and STAT1 phosphorylation in epithelial cells is also critical for Lm-associated intestinal epithelium response. GC depletion also leads to a decrease in colon mucus barrier thickness, thereby increasing host susceptibility to colitis. This study unveils a novel innate immune response to an enteropathogen, which implicates gp38+ stromal cells and locks intestinal villus invasion, but favors colitis.


Figures

None
Graphical abstract
Figure 1.
Figure 1.
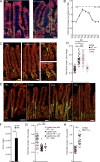
Lm-induced epithelial cell proliferation in an InlA-independent but PP-dependent manner. (A) Fluorescent imaging of sections of the ileum obtained from KIE16P mice 4 d after oral infection with 5 × 10⁹ Lm. 16 h before euthanasia, mice were injected with BrdU. Sections are stained for proliferating cells (BrdU), epithelial cells (Ecad), and nuclei (Hoechst). Bars, 20 µm. (B) Quantification over time of epithelial proliferation. Fold increase is measured by dividing the length between the first and last BrdU+ epithelial cells by the length of the villi, normalized by the proliferation from the noninfected mice. n = 9–39 villi/point. Data are pooled from three independent experiments. Mann-Whitney test. (C) Confocal imaging of sections of the ileum obtained from KIE16P mice 2 d after oral infection with 5 × 10⁹ Lm. Sections are stained for proliferating cells (Ki67) and epithelial cells (Ecad). Bars, 20 µm. (D) Quantification of epithelial proliferation in KIE16P littermate mice infected with 5 × 10⁹ Lm and isogenic mutants. Each dot corresponds to one quantified villus, except the red dots, which correspond to the mean of each mouse. At least 5 fields/10 villi per mouse. n = 4 mice/bacterial strain. Data are pooled from two independent experiments. A one-way ANOVA test followed by a Sidak’s multiple comparisons was performed on the mean of each mouse. (E) Confocal imaging of frozen sections of the ileum obtained from KIE16P mice treated as in A with 5 × 10⁹ Lm and isogenic mutants. Bars, 20 µm. (F) Lm burden in PPs and villi from mice infected by 5 × 10⁹ CFUs ΔinlA Lm. Eight mice per group. Data are represented as mean ± SEM. Mann-Whitney test. (G) Quantification of epithelial proliferation in ligated loop of KIE16P mice containing one or no PP infected with 1 × 10⁵ ΔinlA Lm 24 h pi. Each dot corresponds to one quantified villus. At least 5 fields/10 villi per mouse. n = 3–4 mice/condition. One for PP PBS control. Data are pooled from two independent experiments. A one-way ANOVA test followed by a Tukey’s multiple comparisons was performed. (H) Quantification of epithelial proliferation in axenic KIE16P littermate mice infected with 5 × 10⁹ Lm. Each dot corresponds to one quantified villus, except the red dots, which correspond to the mean of each mouse. n = 3–4 mice. Data are pooled from two independent experiments. A Student’s t test was performed on the mean of each mouse. **, P < 0.01; ***, P < 0.001.
Figure 2.
Figure 2.
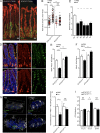
Lm triggers a STAT3-dependent negative feedback loop blocking its access to intestinal villi via GCs. (A) Confocal imaging of sections of the ileum obtained from STAT3IEC-WT and STAT3IEC-KO mice treated as in Fig. 1 A with 5 × 10⁹ Lm and isogenic mutants. Bars, 20 µm. (B) Quantification of epithelial proliferation in STAT3IEC-WT and STAT3IEC-KO littermate mice 4 d after oral inoculation. Each dot corresponds to one quantified villus, except the red dots, which correspond to the mean of each mouse. n = 3–5 mice (PBS) or 6–7 mice (Lm)/condition. Data are pooled from three independent experiments. A one-way ANOVA test followed by a Sidak’s multiple comparisons was performed on the mean of each mouse. (C) Quantification of WGA+ GCs/villous at different time points after inoculation. n = 8–25 independent villi. Data are pooled from two independent experiments. Data are represented as mean ± SEM. Mann-Whitney test. (D) Confocal imaging of sections of the ileum obtained 4 d pi with 5 × 10⁹ Lm and control. Tissue was fixed in Carnoy. Sections are stained for mucus (WGA), Muc2 mucin (Muc2), and nuclei (Hoechst). WGA+ Muc2 cells located in the crypts are Paneth cells, which are not counted. Bars, 20 µm. (E) Quantification of WGA+ GCs/villous in STAT3IEC-WT and STAT3IEC-KO mice infected by 5 × 10⁹ Lm 4 d pi and noninfected control. n = 53–95 villi. Data are pooled from two independent experiments. Data are represented as mean ± SEM. Mann-Whitney test. (F) Quantification of Muc2+ GCs/villous in STAT3IEC-WT and STAT3IEC-KO mice infected by 5 × 10⁹ Lm 4 d pi and noninfected control. n = 53–95 villi. Data are pooled from two independent experiments. Data are represented as mean ± SEM. Mann-Whitney test. (G) Three-dimensional reconstruction of nonpermeabilized intestinal villi stained with WGA and for accessible Ecad and nuclei. (H) Quantification of WGA+ GCs expressing or not accessible Ecad in STAT3IEC-WT and STAT3IEC-KO mice 4 d after inoculation of 5 × 10⁹ Lm ΔinlA from the upper 100 µm of whole mount staining. n = 17–23 villi. Data are representative of two independent experiments with at least three mice per group. Data are represented as mean ± SEM. Mann-Whitney test. (I) Lm burden in intestine of STAT3IEC-WT and STAT3IEC-KO mice infected by WT Lm or the isogenic mutant ΔinlA. A first 3-d inoculation of 5 × 10⁸ CFUs/animal was followed by a 4-d inoculation of 5 × 10⁹ CFUs/animal. Data are pooled of five independent experiments. 13 mice per group for KIE16P mice infected by WT Lm; 10 mice per group for KIE16P mice infected by Lm ΔinlA and four mice per group for C57BL/6 infected by WT Lm. Wilcoxon test; animals are paired by subgroups for each experiment. *, P < 0.1; **, P < 0.01; ***, P < 0.001.
Figure 3.
Figure 3.
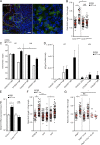
IL-23 produced by CX3CR1 is involved in Lm-associated epithelial proliferation. (A) Confocal imaging of a vibratome section from a PP infected by 5 × 10⁹ Lm 24 h after oral inoculation. Bars, 20 µm. (B) Quantification of epithelial proliferation in Cx3cr1GFP/GFP and Cx3cr1GFP/+ cohoused control mice 4 d after oral inoculation. **, P < 0.01; ***, P < 0.001. Each dot corresponds to one quantified villus, except the red dots, which correspond to the mean of each mouse. n = 4 mice/condition. Data are pooled from three independent experiments. A one-way ANOVA test followed by a Sidak’s multiple comparisons was performed on the mean of each mouse. (C) Cell number per organ counted by flow cytometry. All PP versus entire intestinal tissue. Data are representative of two independent experiments with three mice per group. Data are represented as mean ± SEM. A one-way ANOVA test followed by a Sidak’s multiple comparisons was performed on the mean of each mouse. (D) Il23p19 mRNA quantification by qRT-PCR on sorted PPs and villi CX3CR1 and CX3CR1+ cells 24 h pi. Data are representative of two independent experiments with at least three mice per group. Data are represented as mean ± SEM. (E) Il23p19 mRNA quantification by qRT-PCR from intestinal tissue of Cx3cr1GFP/GFP and Cx3cr1GFP/+ mice 24 h pi. Data are pooled of three independent experiments. Six Cx3cr1+/+ mice; seven Cx3cr1GFP/GFP mice. Data are represented as mean ± SEM. Student’s t test. (F) Quantification of epithelial proliferation in control cohoused C57BL/6 and mutant mice 4 d after oral inoculation. Each dot corresponds to one quantified villus, except the red dots, which correspond to the mean of each mouse. n = 4–9 mice/condition. Data are pooled from four independent experiments. A one-way ANOVA test followed by a Sidak’s multiple comparisons was performed on the mean of each mouse. (G) Quantification of epithelial proliferation in cohoused Rag2−/− and Rag2−/−IL17ra−/− injected or not with a blocking αIL-22 antibody 4 d after oral inoculation. Each dot corresponds to one quantified villus, except the red dots, which correspond to the mean of each mouse. n = 12–57 villi. Data are pooled of two independent experiments. A one-way ANOVA test followed by a Sidak’s multiple comparisons was performed on the mean of each mouse. *, P < 0.05; **, P < 0.01; ****, P < 0.0001.
Figure 4.
Figure 4.
IL-11 expressed by Gp38+ stromal cells in an IL-23–dependent manner is involved in Lm-associated epithelial proliferation. (A) Il11 mRNA quantification by qRT-PCR from intestinal tissue of Il23+/+ and Il23−/− mice 48 h pi. Data are pooled of two independent experiments. Five Il23+/+ mice; four Il23−/− mice. Data are represented as mean ± SEM. Student’s t test. (B) Quantification of epithelial proliferation in littermate Il11ra1+/− and Il11ra1−/− mice injected or not with a blocking αIL-22 antibody 4 d after oral inoculation. Each dot corresponds to one quantified villus, except the red dots, which correspond to the mean of each mouse. At least 5 fields/10 villi per mouse. n = 3–8 mice/condition. Data are pooled of three independent experiments. A one-way ANOVA test followed by a Sidak’s multiple comparisons was performed on the mean of each mouse. (C) Il11 mRNA quantification by qRT-PCR from sorted LP populations, as indicated, 48 h pi. Data are representative of two independent experiments. Three animals per group. Data are represented as mean ± SEM. Student’s t test. (D) IL-11 protein quantification by an ELISA assay from sorted CD45 gp38+ stromal cells stimulated in vitro with the indicated cytokines. Data are pooled of three independent experiments. Six culture wells per condition. Data are represented as mean ± SEM. Mann-Whitney test. (E) Quantification of epithelial proliferation in Il23−/− littermate mice complemented with rmIL-22, rmIL-17, and rmIL-11 4 d after oral inoculation. Each dot corresponds to one quantified villus except the red dots, which correspond to the mean of each mouse. n = 4–7 mice/condition. Data are pooled of three independent experiments. A one-way ANOVA test followed by a Sidak’s multiple comparisons was performed on the mean of each mouse. (F) Quantification of WGA+ GCs/villous in Il23−/− mice complemented with recombinant IL-11 and IL-22, infected by 5 × 10⁹ Lm 4 d pi and noninfected control. n = 10–30 villi. Data are representative of two independent experiments. Data are represented as mean ± SEM. Mann-Whitney test. *, P < 0.05; **, P < 0.01.
Figure 5.
Figure 5.
IFN-γ produced by NK cells is involved in Lm-associated epithelial proliferation. (A) Quantification of epithelial proliferation in cohoused C57BL/6 control and Ifnγ−/− mice 4 d after oral inoculation. Each dot corresponds to one quantified villus, except the red dots, which correspond to the mean of each mouse. At least 5 fields/10 villi per mouse. n = 3–5 mice/condition. Data are pooled of two independent experiments. A one-way ANOVA test followed by a Sidak’s multiple comparisons was performed on the mean of each mouse. (B) Quantification by flow cytometry analysis of IFN-γ+ cells. Data are pooled of three independent experiments. n = 4–5 animals per group. Data are represented as mean ± SEM. Student’s t test. (C) Quantification of epithelial proliferation in cohoused Rag2−/−, Rag2−/− γc−/−, Rag2−/−Il15−/− injected with a blocking αNK1.1 antibody 4 d after oral inoculation. Each dot corresponds to one quantified villus, except the red, green, and blue dots which correspond to the mean of each mouse. n = 3–6 mice per condition. Data are pooled of two independent experiments. A one-way ANOVA test followed by a Sidak’s multiple comparisons was performed on the mean of each mouse. (D) I12p35 mRNA quantification by qRT-PCR on sorted PPs and villi CX3CR1 and CX3CR1+ cells 24 h pi. Data are representative of two independent experiments with at least three mice per group. Data are represented as mean ± SEM. Student’s t test. (E) Quantification of epithelial proliferation in C57BL/6:IfnγR−/− and IfnγR−/−:C57BL/6 chimera mice 4 d after oral inoculation. Data are pooled of two independent experiments with two to four mice per group. *, P < 0.05; **, P < 0.01; ***, P < 0.001.
Figure 6.
Figure 6.
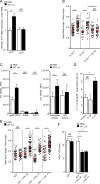
IL-23 and IFN-γ pathways complement to induce epithelial proliferation. (A) Maximum intensity projection of Z stacks from organoids incubated with the indicated cytokines. (B) Quantification of BrdU incorporation in organoids incubated with the indicated cytokines and treatment, detailed in the supplemental procedures. n = 8–10 pooled organoids from two independent experiments. A one-way ANOVA test followed by a Sidak’s multiple comparisons was performed. (C) Quantification of BrdU incorporation in organoids incubated with the indicated cytokines and treatment, detailed in the supplemental material. n = 15–17 pooled organoids from three independent experiments. A one-way ANOVA test followed by a Sidak’s multiple comparisons was performed. (D) Quantification of BrdU incorporation in organoids incubated with the indicated cytokines and treatment, detailed in the supplemental material. n = 4 (PBS) or 5 (IFN-γ + IL-22) organoids pooled from two plates, representative of two independent experiments. A one-way ANOVA test followed by a Sidak’s multiple comparisons was performed. (E) Quantification of BrdU incorporation in organoids incubated with the indicated cytokines and treatment, detailed in the supplemental material. n = 5 organoids pooled from two plates for each condition. A one-way ANOVA test followed by a Sidak’s multiple comparisons was performed. *, P < 0.05; **, P < 0.01.
Figure 7.
Figure 7.
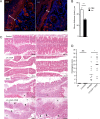
Lm-associated sensitization to colitis. (A) Confocal imaging of sections of Carnoy’s fixed colons 4 d pi, 5 × 10⁹ Lm ΔinlA. Sections are stained for Muc2 mucin (Muc2) and nuclei (Hoechst). Bars, 20 µm. (B) Quantification of mucus thickness, in µm. n = 26 to 31 measures. Data are represented as mean ± SEM. Mann-Whitney test. (C) Hematoxylin and eosin staining of Lm ΔinlA-infected and DSS-treated mice. (D) Score of histological lesions induced in DSS-treated mice. One point represents one mouse. NI, not infected; DSS, DSS-treated mice. Data are pooled from two independent experiments. A one-way ANOVA test followed by a Sidak’s multiple comparisons was performed. *, P < 0.05; ***, P < 0.001.
Figure 8.
Figure 8.
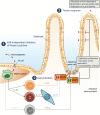
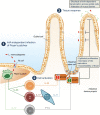
Model of the mechanisms and downstream effects induced by Lm infection at the villus epithelial level. Lm infects CX3CR1+ cells in PPs (in an InlA-independent manner; 1), triggering both IL-23–IL-22–IL-11 and IL-12–IFN-γ pathways (2). Activation of STAT3 and STAT1 in intestinal epithelial cells leads to an increase of epithelial proliferation and a decrease of goblet cells expressing accessible Ecad. As a consequence, Lm intestinal villus invasion via GCs (which is InlA/Ecad dependent) is blocked, and mucus barrier is altered (3).

Similar articles

Cited by

References

    1. Andersson A., Dai W.J., Di Santo J.P., and Brombacher F.. 1998. Early IFN-gamma production and innate immunity during Listeria monocytogenes infection in the absence of NK cells. J. Immunol. 161:5600–5606. - PubMed
    1. Andoh A., Zhang Z., Inatomi O., Fujino S., Deguchi Y., Araki Y., Tsujikawa T., Kitoh K., Kim-Mitsuyama S., Takayanagi A., et al. . 2005. Interleukin-22, a member of the IL-10 subfamily, induces inflammatory responses in colonic subepithelial myofibroblasts. Gastroenterology. 129:969–984. 10.1053/j.gastro.2005.06.071 - DOI - PubMed
    1. Aparicio-Domingo P., Romera-Hernandez M., Karrich J.J., Cornelissen F., Papazian N., Lindenbergh-Kortleve D.J., Butler J.A., Boon L., Coles M.C., Samsom J.N., and Cupedo T.. 2015. Type 3 innate lymphoid cells maintain intestinal epithelial stem cells after tissue damage. J. Exp. Med. 212:1783–1791. 10.1084/jem.20150318 - DOI - PMC - PubMed
    1. Asker N., Axelsson M.A., Olofsson S.O., and Hansson G.C.. 1998. Dimerization of the human MUC2 mucin in the endoplasmic reticulum is followed by a N-glycosylation-dependent transfer of the mono- and dimers to the Golgi apparatus. J. Biol. Chem. 273:18857–18863. 10.1074/jbc.273.30.18857 - DOI - PubMed
    1. Aychek T., Mildner A., Yona S., Kim K.W., Lampl N., Reich-Zeliger S., Boon L., Yogev N., Waisman A., Cua D.J., and Jung S.. 2015. IL-23-mediated mononuclear phagocyte crosstalk protects mice from Citrobacter rodentium-induced colon immunopathology. Nat. Commun. 6:6525 10.1038/ncomms7525 - DOI - PMC - PubMed

Publication types

MeSH terms