. 2018 Oct 8:9:2324.
doi: 10.3389/fmicb.2018.02324. eCollection 2018.

Importance of Promyelocytic Leukema Protein (PML) for Kaposi's Sarcoma-Associated Herpesvirus Lytic Replication

Affiliations

Importance of Promyelocytic Leukema Protein (PML) for Kaposi's Sarcoma-Associated Herpesvirus Lytic Replication

Md Golzar Hossain et al. Front Microbiol. .

Abstract

Many DNA virus replication-related proteins are associated with promyelocytic leukemia protein (PML), a component of nuclear domain 10 (ND10), which has been investigated for its potential involvement in viral replication. In the case of Kaposi's sarcoma-associated herpesvirus (KSHV) lytic gene products, K8 (K-bZIP), ORF59, and ORF75 have been shown to colocalize with PML, but its importance in KSHV lytic replication is still unclear. In this study, we analyzed the functional influence of PML on KSHV latency and lytic replication in KSHV-infected primary effusion lymphoma (PEL) cell lines. Stable PML-knockout (BC3-PMLKO) and PML-overexpressing BC3 cells (BC3PML) were successfully generated and the latency and reactivation status were analyzed. The results demonstrated that neither KSHV latency nor the episome copy number was affected in BC3-PMLKO cells. In the reactivation phase, the expression dynamics of KSHV immediate-early or early lytic proteins such as RTA, K9 (vIRF1), K5, K3, ORF59, and K8 (K-bZIP) were comparable between wild-type, control BC3, and BC3-PMLKO cells. Interestingly, KSHV lytic replication, virion production, and expression of late genes were downregulated in BC3-PMLKO cells and upregulated in BC3PML cells, compared to those in control or wild-type BC3 cells. Moreover, exogenous PML increased the size of the PML dots and recruited additional K8 (K-bZIP) to PML-NBs as dots. Therefore, PML would function as a positive regulator for KSHV lytic DNA replication by recruiting KSHV replication factors such as 8 (K-bZIP) or ORF59 to the PML-NBs.

Keywords: Kaposi’s sarcoma-associated herpesvirus (KSHV); ND10; PEL cells; latency; lytic replication; promyelocytic leukema protein (PML).


Figures

FIGURE 1
FIGURE 1
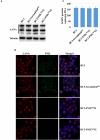
Establishment of stable PML-knockout BC3 cells. Stable PML-knockout BC3 cells (BC3-PMLKO#1 and BC3-PMLKO#2) and the control one (BC3-ScrambledKO) were generated from wild-type BC3 cells by puromycin selection after transduction with lentivirus as described in the Materials and Methods. (A) Western blot analysis of PML expression. Extracted total lysates from wild-type, control, and PML-knockout cells were separated on an SDS–PAGE and immunoblotted with antibodies to PML, DAXX and SP100. Specific proteins were visualized by using HRP conjugated secondary Abs. β-tubulin was used as a loading control. (B) Immunofluorescence analysis. The cells were fixed, permeabilized and stained with a mouse anti-PML Ab followed by an Alexa Fluor® 546 conjugated anti-mouse IgG (red). The cell nuclei were stained with DAPI (blue).
FIGURE 2
FIGURE 2
Analysis of LANA expression and KSHV episomes in the PML-knockout cells. (A) Immunoblot analysis of LANA. Total proteins were extracted from the wild-type (BC3), the control (BC3-ScrambledKO), and the stable PML-knockout cells (BC3-PMLKO#1 and BC3-PMLKO#2). The proteins separated on an SDS–PAGE were immunoblotted with a LANA antibody. These samples were the same as those shown Figure 1A and thus, the β-tubulin as a loading control for each lane was also the same as one in Figure 1A. (B) Immunofluorescence analysis of LANA and PML. The cells were stained with a rat anti-LANA and a mouse anti-PML antibody followed by Alexa Fluor® 546 and Alexa Fluor® 488 conjugated anti-rat IgG (red) and anti-mouse IgG (green), respectively. The cell nuclei were stained with DAPI and shown in blue. (C) KSHV episome copy number quantification. Total DNA from the cells was extracted and the KSHV episome copy number was quantified by qPCR with a KSHV gene-specific primer set and the data were shown KSHV genome copy/ pg DNA. The results are presented as an average of three replicates with error bars representing SEs.
FIGURE 3
FIGURE 3
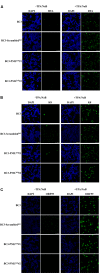
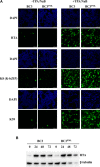
Induction of KSHV lytic replication by TPA and NaB treatment. The cells were treated with TPA (25 ng/mL) and NaB (0.6 mM) and incubated for 48 h. The collected cells were then stained with antibodies against the indicated specific proteins followed by an Alexa Fluor® 488 conjugated IgG (green) and analyzed by a confocal microscope. Different panels show the staining of RTA (A), K8 (K-bZIP) (B), and ORF59 (C) with or without TPA/NaB treatment. The cell nuclei were stained with DAPI (blue). The experiment was performed at least three times independently and one representative result is shown.
FIGURE 4
FIGURE 4
Expression dynamics of KSHV lytic replication-related proteins. The KSHV lytic replication in wild-type (BC3), control (BC3-ScrambledKO), and stable PML-knockout cells (BC3-PMLKO#1 and BC3-PMLKO#2) was induced with the treatment of TPA (25 ng/mL) and NaB (0.3 mM) and the cells were collected at the indicated time points. The total proteins were extracted and immunoblotted with the antibodies against the indicated specific proteins. β-tubulin was used as a loading control. The experiment was performed at least three times independently and one representative result is shown.
FIGURE 5
FIGURE 5
Kaposi’s sarcoma-associated herpesvirus lytic DNA replication, virion production, and late-gene expression kinetics in PML-knockout cells. KHSV lytic replication was induced with TPA (25 ng/mL) and NaB (0.6 mM) treatment and the cells and the supernatants were collected at the indicated time points. The total DNA from the cells and KSHV virion DNA from the concentrated culture supernatants were extracted and the viral DNA was quantified as described in the Materials and Methods. (A) Intracellular KSHV DNA replication normalized by an endogenous control gene GAPDH. The data were shown as fold induction where the KHSV genomic DNA copy at the time zero was set at 1. (B) Extracellular virion production. The data were presented as an average of three replicates with error bars representing SEs. Statistically significant; P < 0.05. (C) Total proteins were extracted from the induced cells and immunoblotted with the antibodies against the indicated specific protein. β-tubulin was used as a loading control. (D) Graphs show relative expression levels of K8.1 and gB to β-tubulin generated from the Western blot band intensities.
FIGURE 6
FIGURE 6
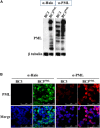
Overexpression of PML in BC3 cells. Wild-type BC3 cells were transduced with a halo-tagged PML-encoding retrovirus, and stable PML-expressing cells were established after hygromycin selection. (A) Total protein from the cells were extracted and immunoblotted with an anti (α)-Halo and an α-PML Ab for detection of PML. β-tubulin was used as a loading control. (B) Cells stably expressing PML were fixed and stained with a mouse α-Halo and a rabbit α-PML Ab and signals were visualized via immunofluorescence using an Alexa Fluor® 488 (green) conjugated anti-mouse IgG and an Alexa Fluor® 548 (red) conjugated anti-rabbit IgG, respectively. The cell nuclei were stained with DAPI (blue).
FIGURE 7
FIGURE 7
Induction of KSHV lytic replication in BC3 cells stably overexpressing PML. Wild-type and PML-overexpressing cells were treated with TPA (25 ng/mL) and NaB (0.6 mM) and incubated up to 72 h. (A) Immunofluorescence analysis. The cells at 0 or 48 h post-induction were collected and stained with antibodies against the indicated specific proteins followed by an Alexa Fluor® 488 conjugated IgG (green) and analyzed by a confocal microscope. The cell nuclei were stained with DAPI (blue). (B) Western blot analysis. Total protein was extracted from the cells collected at the indicated time points and immunoblotted with the antibodies against the indicated specific proteins. β-tubulin was used as a loading control.
FIGURE 8
FIGURE 8
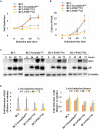
Kaposi’s sarcoma-associated herpesvirus lytic DNA replication, virion production, and late-gene expression were upregulated by exogenous PML. The wild-type and BC3 cells stably expressing exogenous PML were treated with TPA (25 ng/mL) and NaB (0.6 mM) to induce the KSHV lytic replication. The total DNA from the cells and KSHV virion DNA from the concentrated culture supernatants were extracted at the indicated time points. The viral DNA was quantified using a KSHV gene-specific primer set as described in the Materials and Methods. (A) Intracellular KSHV DNA, normalized by endogenous control gene GAPDH. (B) Extracellular virion associated DNA. The data are presented as an average fold induction of three replicates with error bars representing the SEs. Statistically significant; P < 0.05. (C) Total protein was extracted from the induced cells and immunoblotted with the antibodies against the indicated specific proteins. β-tubulin was used as a loading control.
FIGURE 9
FIGURE 9
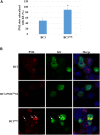
Subcellular distribution of K8 (K-bZIP) in wild-type, PML-knockout, and PML-overexpressing BC3 cells. The cells were collected 48 h after treatment with TPA (25 ng/mL) and NaB (0.6 mM). Then the cells were fixed and stained with an anti-K8 (K-bZIP) Ab (mouse) and an anti-PML (rabbit) followed by Alexa Fluor® 488 conjugated mouse IgG (green) and an Alexa Fluor® 548 conjugated rabbit IgG (red), respectively. The cell nuclei were highlighted with DAPI. (A) Percentage of PML dots colocalized with K8 (K-bZIP) in wild-type and PML-overexpressing BC3 cells. The results showed the percentages of K8 (K-bZIP) and PML colocalized dots. PML dots were counted in the lytic induced BC3 and BC3PML cells. The data are presented as an average of three replicates with error bars representing SEs. Statistically significant; P < 0.05. (B) K8 (K-bZIP) and PML colocalization pattern. Arrows indicate the accumulation of K8 (K-bZIP) to the PML dots.

Similar articles

Cited by

References

    1. Adamson A. L., Kenney S. (2001). Epstein-barr virus immediate-early protein BZLF1 is SUMO-1 modified and disrupts promyelocytic leukemia bodies. J. Virol. 75 2388–2399. 10.1128/jvi.75.5.2388-2399.2001 - DOI - PMC - PubMed
    1. Ahn J. H., Brignole E. J., III, Hayward G. S. (1998). Disruption of PML subnuclear domains by the acidic IE1 protein of human cytomegalovirus is mediated through interaction with PML and may modulate a RING finger-dependent cryptic transactivator function of PML. Mol. Cell. Biol. 18 4899–4913. 10.1128/MCB.18.8.4899 - DOI - PMC - PubMed
    1. Akula S. M., Pramod N. P., Wang F. Z., Chandran B. (2001). Human herpesvirus 8 envelope-associated glycoprotein B interacts with heparan sulfate-like moieties. Virology 284 235–249. 10.1006/viro.2001.0921 - DOI - PubMed
    1. Amon W., White R. E., Farrell P. J. (2006). Epstein-Barr virus origin of lytic replication mediates association of replicating episomes with promyelocytic leukaemia protein nuclear bodies and replication compartments. J. Gen. Virol. 87(Pt 5) 1133–1137. 10.1099/vir.0.81589-0 - DOI - PubMed
    1. Bernardi R., Pandolfi P. P. (2007). Structure, dynamics and functions of promyelocytic leukaemia nuclear bodies. Nat. Rev. Mol. Cell Biol. 8 1006–1016. 10.1038/nrm2277 - DOI - PubMed