

Mutational interactions define novel cancer subgroups
- PMID: 30341300
- PMCID: PMC6195543
- DOI: 10.1038/s41467-018-06867-x
Mutational interactions define novel cancer subgroups
Abstract
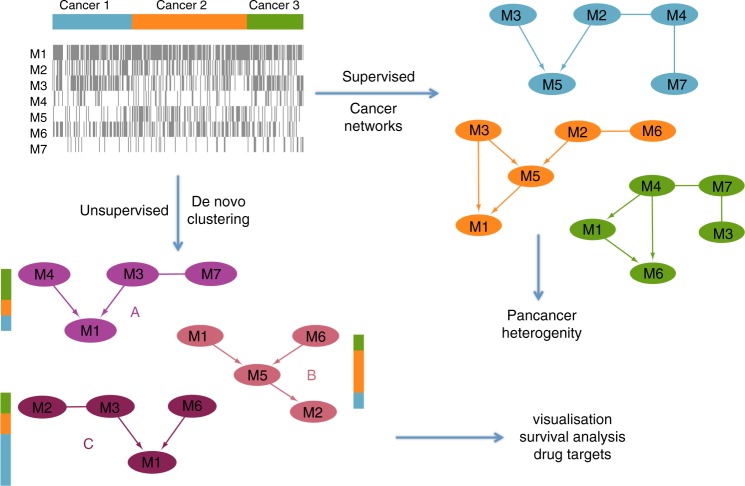
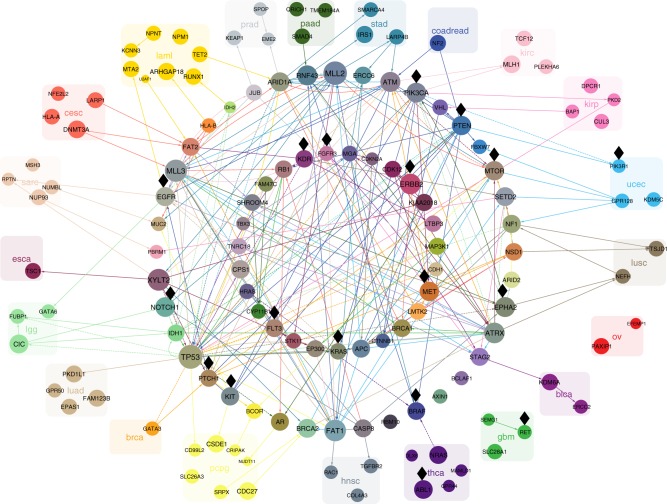
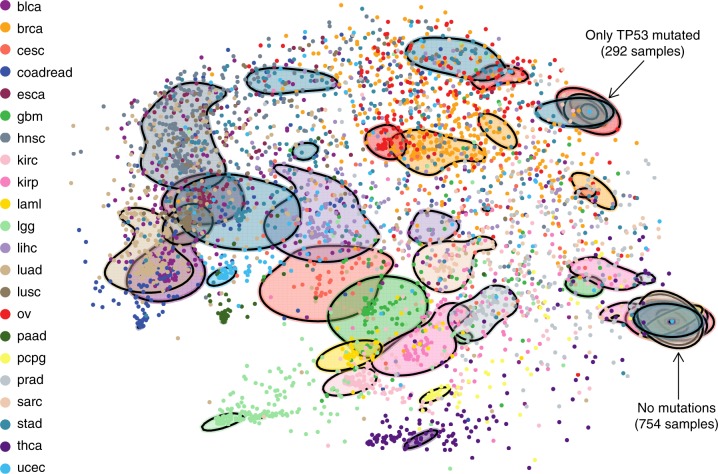
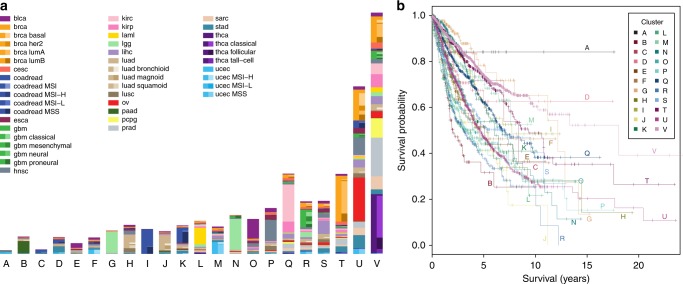
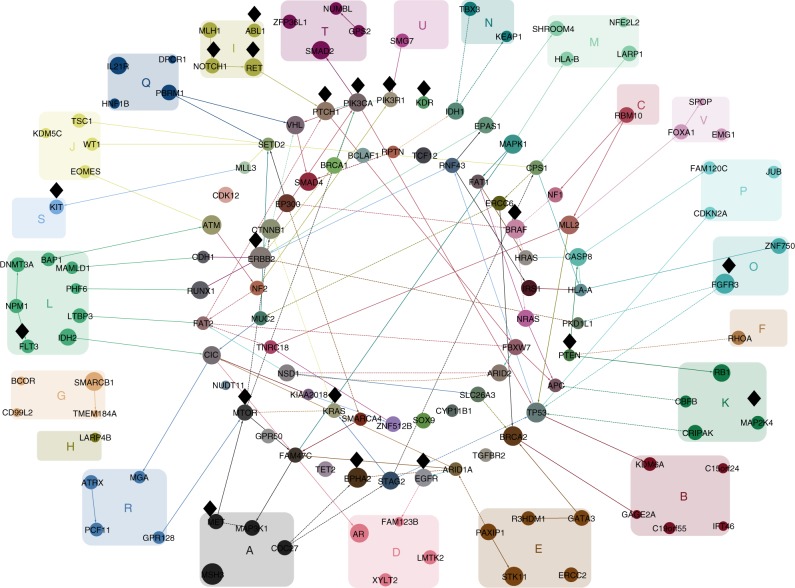
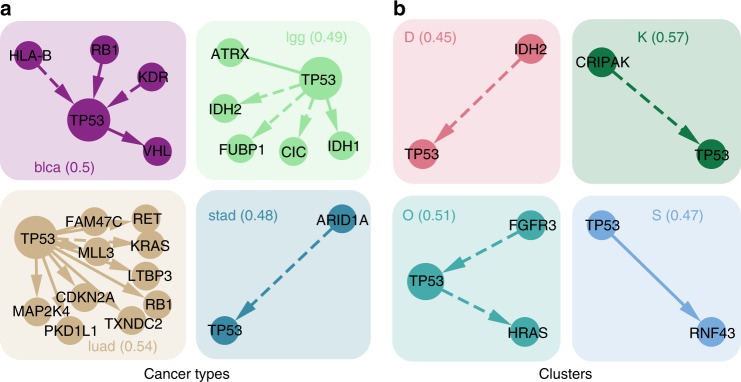
Large-scale genomic data highlight the complexity and diversity of the molecular changes that drive cancer progression. Statistical analysis of cancer data from different tissues can guide drug repositioning as well as the design of targeted treatments. Here, we develop an improved Bayesian network model for tumour mutational profiles and apply it to 8198 patient samples across 22 cancer types from TCGA. For each cancer type, we identify the interactions between mutated genes, capturing signatures beyond mere mutational frequencies. When comparing mutation networks, we find genes which interact both within and across cancer types. To detach cancer classification from the tissue type we perform de novo clustering of the pancancer mutational profiles based on the Bayesian network models. We find 22 novel clusters which significantly improve survival prediction beyond clinical information. The models highlight key gene interactions for each cluster potentially allowing genomic stratification for clinical trials and identifying drug targets.
Conflict of interest statement
The authors declare no competing interests.
Figures
Similar articles
-
Discovery of mutated subnetworks associated with clinical data in cancer.Pac Symp Biocomput. 2012:55-66. Pac Symp Biocomput. 2012. PMID: 22174262
-
Characterizing genomic differences of human cancer stratified by the TP53 mutation status.Mol Genet Genomics. 2018 Jun;293(3):737-746. doi: 10.1007/s00438-018-1416-7. Epub 2018 Jan 12. Mol Genet Genomics. 2018. PMID: 29330617
-
Pan-cancer integrative analysis of whole-genome De novo somatic point mutations reveals 17 cancer types.BMC Bioinformatics. 2022 Jul 25;23(1):298. doi: 10.1186/s12859-022-04840-6. BMC Bioinformatics. 2022. PMID: 35879674 Free PMC article.
-
[Mutational tumor profiles beyond organ and tissue specificity: implications for diagnostics and clinical study design].Pathologe. 2014 Nov;35 Suppl 2:277-80. doi: 10.1007/s00292-014-2027-7. Pathologe. 2014. PMID: 25394977 Review. German.
-
Computational approaches for discovery of mutational signatures in cancer.Brief Bioinform. 2019 Jan 18;20(1):77-88. doi: 10.1093/bib/bbx082. Brief Bioinform. 2019. PMID: 28968631 Free PMC article. Review.
Cited by
-
Multi-omics subtyping of hepatocellular carcinoma patients using a Bayesian network mixture model.PLoS Comput Biol. 2022 Sep 6;18(9):e1009767. doi: 10.1371/journal.pcbi.1009767. eCollection 2022 Sep. PLoS Comput Biol. 2022. PMID: 36067230 Free PMC article.
-
Bayesian Network Modeling Applied to Feline Calicivirus Infection Among Cats in Switzerland.Front Vet Sci. 2020 Feb 26;7:73. doi: 10.3389/fvets.2020.00073. eCollection 2020. Front Vet Sci. 2020. PMID: 32175337 Free PMC article.
-
Network-based approaches for modeling disease regulation and progression.Comput Struct Biotechnol J. 2022 Dec 16;21:780-795. doi: 10.1016/j.csbj.2022.12.022. eCollection 2023. Comput Struct Biotechnol J. 2022. PMID: 36698974 Free PMC article. Review.
-
Joint inference of exclusivity patterns and recurrent trajectories from tumor mutation trees.Nat Commun. 2023 Jun 21;14(1):3676. doi: 10.1038/s41467-023-39400-w. Nat Commun. 2023. PMID: 37344522 Free PMC article.
-
Cancer Classification at the Crossroads.Cancers (Basel). 2020 Apr 15;12(4):980. doi: 10.3390/cancers12040980. Cancers (Basel). 2020. PMID: 32326638 Free PMC article.
References
Publication types
MeSH terms
Grants and funding
LinkOut - more resources
Full Text Sources
