

The fungal ligand chitin directly binds TLR2 and triggers inflammation dependent on oligomer size
- PMID: 30337494
- PMCID: PMC6280652
- DOI: 10.15252/embr.201846065
The fungal ligand chitin directly binds TLR2 and triggers inflammation dependent on oligomer size
Abstract
Chitin is the second most abundant polysaccharide in nature and linked to fungal infection and asthma. However, bona fide immune receptors directly binding chitin and signaling immune activation and inflammation have not been clearly identified because polymeric crude chitin with unknown purity and molecular composition has been used. By using defined chitin (N-acetyl-glucosamine) oligomers, we here identify six-subunit-long chitin chains as the smallest immunologically active motif and the innate immune receptor Toll-like receptor (TLR2) as a primary fungal chitin sensor on human and murine immune cells. Chitin oligomers directly bind TLR2 with nanomolar affinity, and this fungal TLR2 ligand shows overlapping and distinct signaling outcomes compared to known mycobacterial TLR2 ligands. Unexpectedly, chitin oligomers composed of five or less subunits are inactive, hinting to a size-dependent system of immuno-modulation that appears conserved in plants and humans. Since blocking of the chitin-TLR2 interaction effectively prevents chitin-mediated inflammation in vitro and in vivo, our study highlights the chitin-TLR2 interaction as a potential target for developing novel therapies in chitin-related pathologies and fungal disease.
Keywords: N‐acetyl‐glucosamine; anti‐fungal innate immunity; chitin; inflammation; toll‐like receptor.
© 2018 The Authors.
Figures
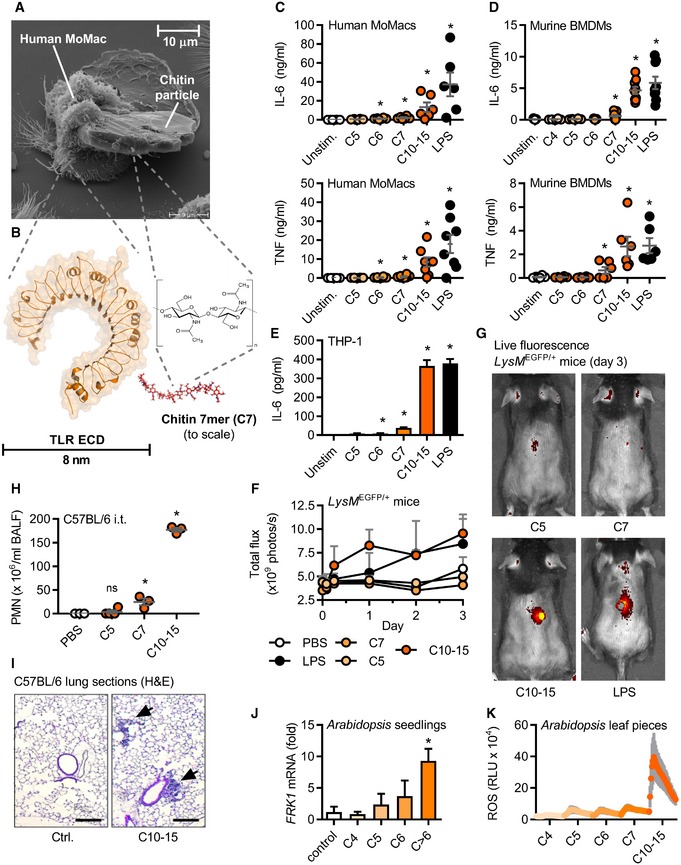
- A
Electron micrograph of a human MoMac engulfing a crude chitin particle (n = 2).
- B–E
(B) Size comparison (to scale) of typical TLR ectodomain and a chitin 7‐mer (seven NAG subunits). Release of IL‐6 and/or TNF release (ELISA) from (C) human MoMacs (n = 6–8), (D) murine BMDMs (n = 6), or (E) THP‐1 cells (n = 3).
- F, G
(F) GFP in vivo fluorescence post‐intradermal injection of chitin oligomers into LysM EGFP/+ C57BL/6 mice (n = 3/group). (G) Representative in vivo imaging results.
- H, I
Leukocyte infiltration in vivo after intratracheal administration assessed by (H) BALF flow cytometry (n = 3–4/group) and (I) histology analysis (n = 2), scale bar = 200 μm, arrows show cellular infiltrate.
- J, K
Arabidopsis thaliana seedling (J) target gene mRNA induction (n = 3) or leaf piece (K) ROS production (0–45 min, n = 6).
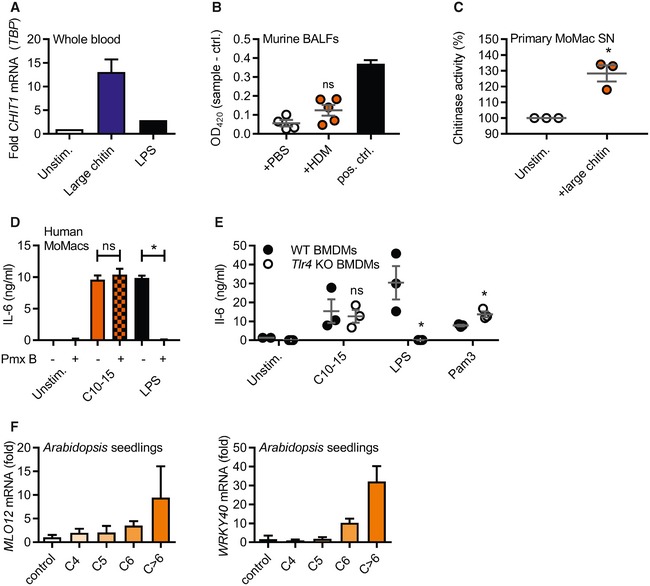
- A
mRNA induction of CHIT1 relative to TBP and unstimulated conditions in human whole blood treated with large chitin (n = 2).
- B
Chitin azure degradation indicative of chitinase activity in murine BALF from mice previously treated with PBS or house‐dust mite allergen (HDM) in vivo (n = 5). S. griseus recombinant chitinase was used as a positive control.
- C
Primary human MoMacs were stimulated with C10‐15 or large chitin for 24 h and supernatants harvested and incubated with chitin azure (n = 3).
- D, E
Cytokine release induced by chitin is independent of endotoxin. (D) IL‐6 release from stimulated human MoMacs stimulated in the absence or presence of polymyxin B (Pmx B, n = 3), and (E) IL‐6 release from WT or Tlr4 KO BMDMs (n = 3) are shown for one representative batch of C10‐15.
- F
Target gene induction in A. thaliana seedlings. MLO12 and WRKY40 mRNA induction (n = 3).
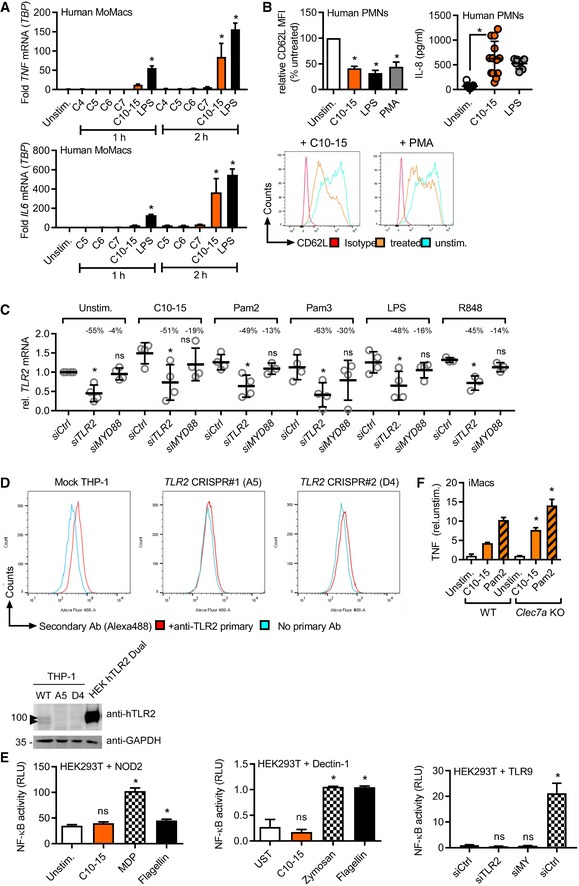
IL6 or TNF mRNA induction relative to TBP in human MoMacs (n = 3).
Relative CD62L shedding (n = 8, histograms shown for one representative donor) and IL‐8 release (n = 7–13) from human PMNs upon 1‐ or 4‐h stimulation, respectively.
TLR2 mRNA knock‐down efficiency upon Ctrl, MYD88 or TLR2 siRNA transfection in human MoMacs (see Fig. 2c), relative to Ctrl siRNA.
TLR2 immunoblot and flow cytometry in TLR2 CRISPR‐edited THP‐1 cells (n = 1 each). Arrowheads denote endogenous TLR2 (glycosylated).
NF‐κB activity in empty vector (EV) or NOD2, Dectin‐1, or TLR9‐transfected HEK293T cells (n = 2–3).
TNF release (relative to unstimulated) from WT or Clec7a KO (Dectin‐1 deficient) immortalized macrophages (iMacs, n = 2).
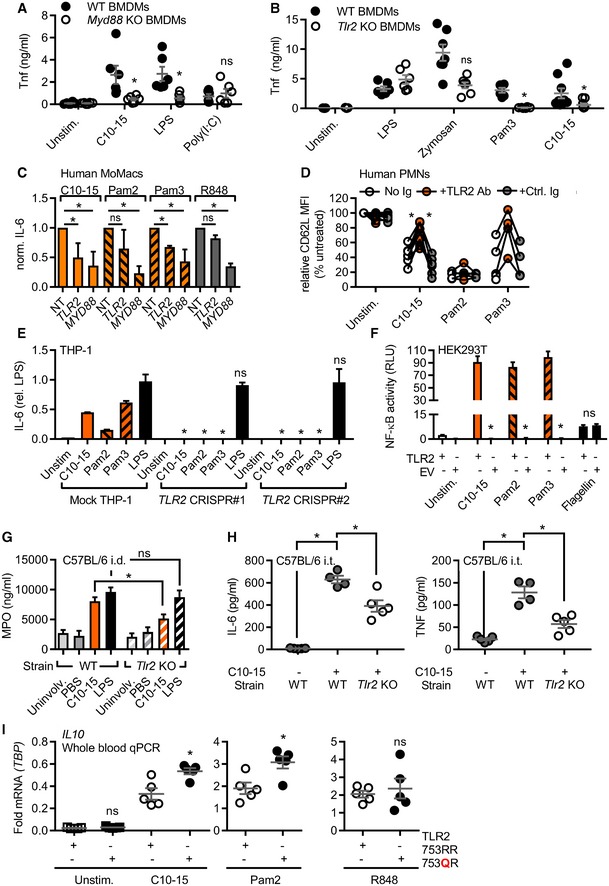
- A, B
TNF released from WT or Myd88 (A) or Tlr2 (B) KO BMDM (total n = 6–9/group combined from three experiments).
- C
IL‐6 released from primary MoMacs (n = 5) treated with non‐targeting (NT), TLR2‐, or MyD88‐specific siRNA relative to NT condition.
- D
CD62L shedding from human PMNs (n = 4–8) with or without isotype control or anti‐TLR2 blocking antibody.
- E
IL‐6 protein released from mock or TLR2 Cas9‐CRISPR‐edited THP‐1 cells (n = 3).
- F
NF‐κB activity in empty vector (EV) or TLR2‐transfected HEK293T cells (n = 3).
- G
MPO release from intradermally injected WT or Tlr2 KO mice (n = 5–15 biopsies each).
- H
BALF IL‐6 and TNF from intratracheally treated WT or Tlr2 KO mice (n = 4–5 mice each).
- I
Relative IL10 mRNA in whole blood of WT or heterozygous TLR2 R753Q carriers (n = 5 each).
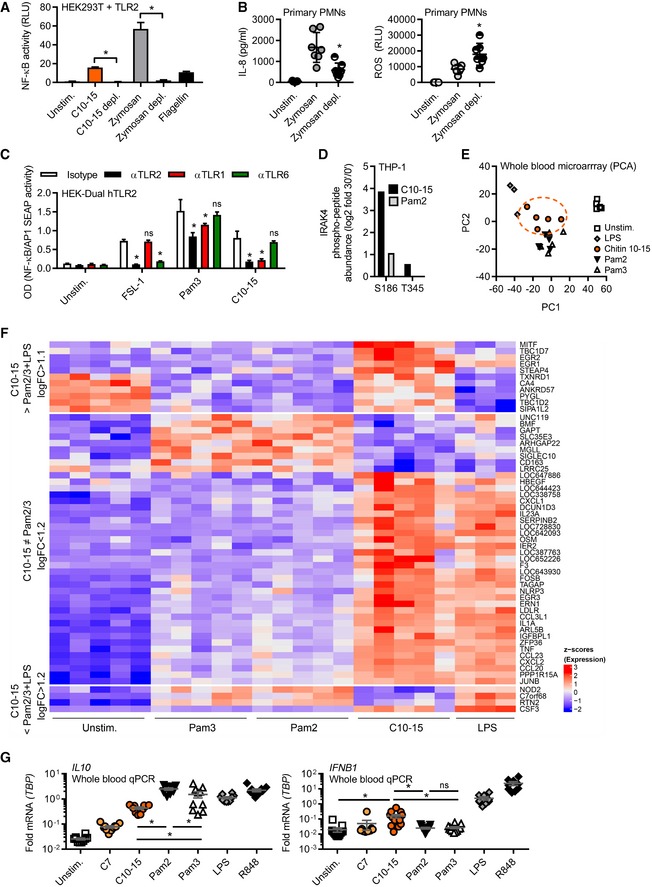
NF‐κB activity in TLR2‐transfected HEK293T cells (n = 3).
IL‐8 release and ROS production from primary PMNs (n = 7).
NF‐κB activity in hTLR2 HEK‐Dual cells pre‐treated with TLR1, TLR2, or TLR6 blocking Abs (n = 2).
IRAK4 S186 and T345 phospho‐site containing IRAK4 peptides quantified in proteome‐wide phospho‐screen in THP‐1 cells (n = 1).
Principal component analysis of microarrays conducted on stimulated whole‐blood samples from healthy donors (n = 3–5).
Microarray intensities (excerpt) of chitin‐specific signature genes (n = 5).
Relative cytokine mRNAs in whole‐blood stimulation (n = 5–13).
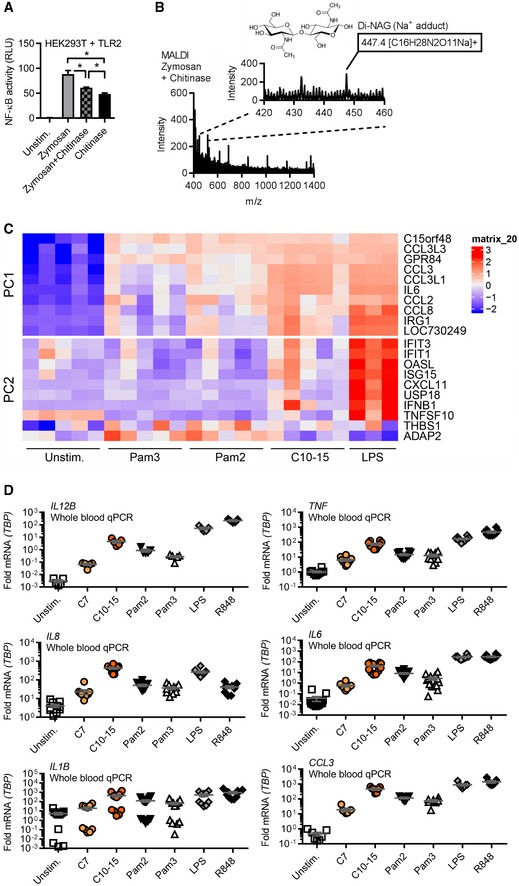
NF‐κB activity in TLR2‐HEK293T cells using zymosan with or without o/n incubation with S. griseus chitinase or chitinase alone. Note: S. griseus chitinase contained TLR2 activity in the absence of an additional stimulant. Incubation of zymosan with this chitinase led to a reduction in this residual level of TLR2 activity.
MALDI‐TOF‐MS analysis of chitinase‐treated zymosan supernatants (n = 2).
Whole‐blood microarray intensities (excerpt) of the 10 genes contributing most strongly to PC1 and PC2, respectively (see Expanded View methods and Code EV1).
Relative cytokine mRNAs in whole‐blood stimulation (n = 5–13).
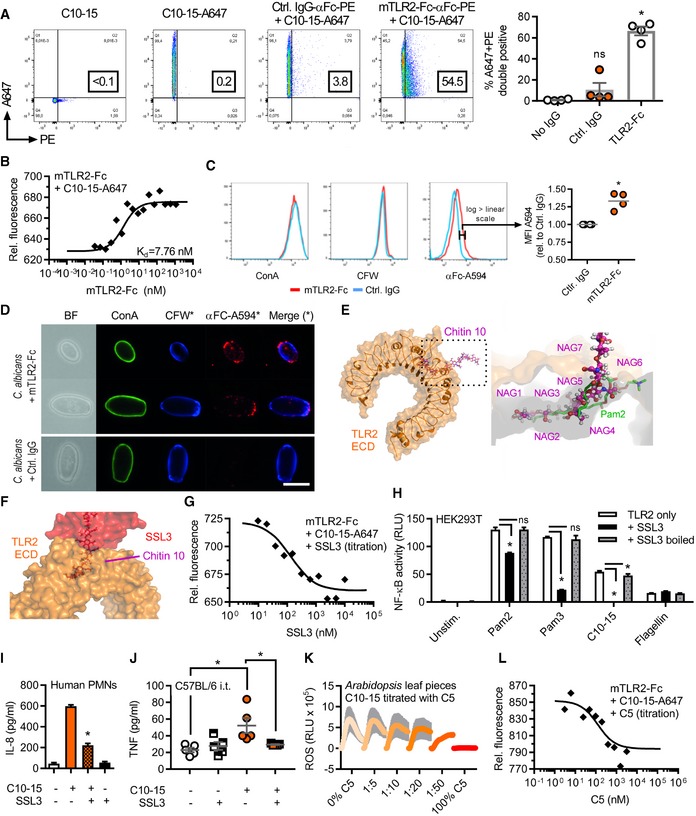
- A, B
Flow cytometric quantification (A) or microscale thermophoresis (MST) analysis (B) of Alexa647‐labeled C10‐15 interaction with mTLR2‐Fc protein (n = 4 each).
- C, D
(C) Flow cytometry and (D) fluorescence microscopy of Candida albicans stained with control IgG or mTLR2‐Fc anti‐Fc‐Alexa594, together with ConA‐Alexa488 and CFW (n = 4 each). Scale bar = 5 μm.
- E, F
(E) Docking of chitin 10 (magenta) into the TLR2 (orange) Pam2 (green) lipopeptide binding pocket (close‐up, pdb: 2z7x), (F) overlaid with SSL3 from a SSL3‐inhibited TLR2 complex (pdb: 5d3i).
- G
MST analysis of Alexa647‐labeled C10‐15 and mTLR2‐Fc protein with SSL3 titration (n = 2).
- H, I
(H) NF‐κB activation in TLR2‐transfected HEK293T cells (n = 3) or (I) IL‐8 release from primary PMNs (n = 2) without or with SSL3.
- J
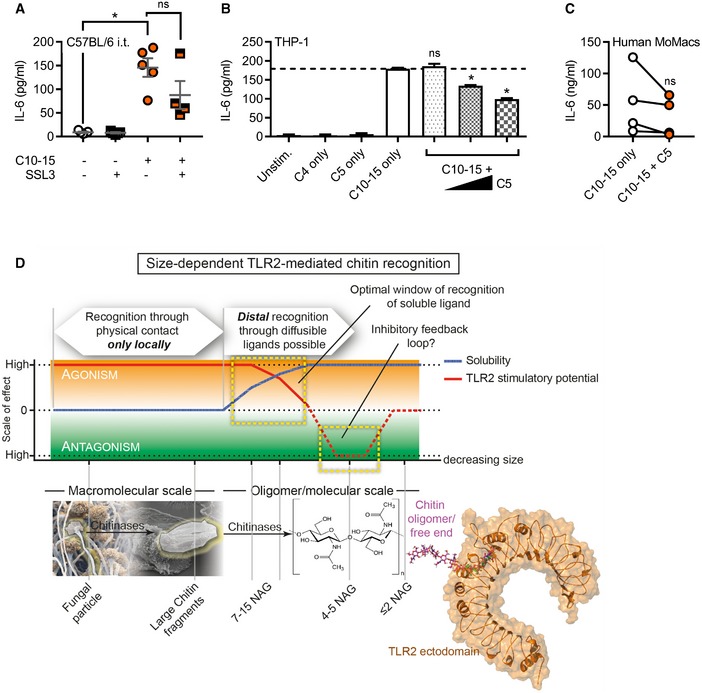
BALF TNF in C57BL/6 mice (n = 5/group) upon C10‐15 administration without or with SSL3.
- K
ROS production between 0 and 45 min post‐chitin application in A. thaliana leaf pieces (n = 6).
- L
MST analysis of Alexa647‐labeled C10‐15 and mTLR2‐Fc Protein with C5 titration (n = 2).
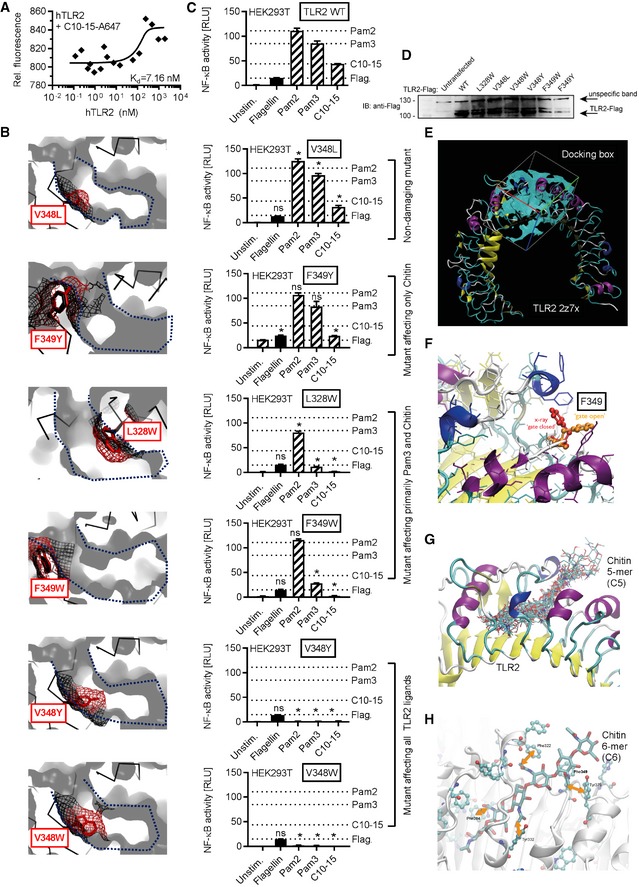
- A
Microscale thermophoresis analysis of Alexa647‐labeled C10‐15 and hTLR2 protein (n = 3).
- B–D
Modeling (B), functional NF‐κB activity (C), and expression levels (D) in empty vector (EV) or TLR2‐transfected HEK293T cells (n = 2) for TLR2 WT or point mutants designed to narrow the hydrophobic pocket. In (B), a blue dotted line delineates the hydrophobic pocket, here shown in cross‐section. Black mesh signifies original surface profile in pdb 2z7x, and red mesh the predicted surface of the respective point mutant. In (C), dotted lines signify the levels of NF‐κB activity observed for WT TLR2 for the respective ligand. (D) Expression of TLR2 mutants verified by anti‐Flag immunoblot (n = 1).
- E
Docking grid used for placing of a chitin 5‐mer.
- F
Close‐up on the gatekeeper F349 which restricts access to the cavity in “closed position” (red) but allows access in “open” rotamer position (orange).
- G
Docking poses of a 5‐mer (C5) in the grid specified in e and with F349 in “open” rotamer position.
- H
Potential interactions of chitin 6‐mer (C6) hydrophobic methyl groups with aromatic side chains in the TLR2 hydrophobic cavity.
- A
BALF IL‐6 in C57BL/6 mice (n = 4–5/group) upon C10‐15 administration without or with SSL3.
- B, C
IL‐6 release from THP‐1 cells (B) or primary MoMacs (C) without or with C5 (n = 3 or 4).
- D
Schematic representation of size‐dependent recognition of chitin oligomers by TLR2. Through the activity of chitinase or physical fragmentation, a range of different sized fragments and oligomers is generated. TLR2 recognition is possible for both particulate chitin as well as diffusible oligomers. As recognition can occur in a window where both activatory potential and solubility are high, distal recognition of fungal pathogens is possible, while the minimum length required for agonism (6 NAG) ensures that mono‐ or disaccharides are prevented from receptor activation. As activating oligomers are cleaved, soluble fragments with antagonistic properties may arise, representing an inherent negative regulatory loop.
Similar articles
-
Chitin oligomers promote lymphoid innate and adaptive immune cell activation.J Leukoc Biol. 2023 Jul 27;114(2):180-186. doi: 10.1093/jleuko/qiad044. J Leukoc Biol. 2023. PMID: 37075217
-
Acylation determines the toll-like receptor (TLR)-dependent positive versus TLR2-, mannose receptor-, and SIGNR1-independent negative regulation of pro-inflammatory cytokines by mycobacterial lipomannan.J Biol Chem. 2007 Sep 7;282(36):26014-25. doi: 10.1074/jbc.M702690200. Epub 2007 Jul 6. J Biol Chem. 2007. PMID: 17617634
-
Dietary Fiber Pectin Directly Blocks Toll-Like Receptor 2-1 and Prevents Doxorubicin-Induced Ileitis.Front Immunol. 2018 Mar 1;9:383. doi: 10.3389/fimmu.2018.00383. eCollection 2018. Front Immunol. 2018. PMID: 29545800 Free PMC article.
-
β-glucan: Crucial component of the fungal cell wall and elusive MAMP in plants.Fungal Genet Biol. 2016 May;90:53-60. doi: 10.1016/j.fgb.2015.12.004. Epub 2015 Dec 10. Fungal Genet Biol. 2016. PMID: 26688467 Review.
-
The structure and synthesis of the fungal cell wall.Bioessays. 2006 Aug;28(8):799-808. doi: 10.1002/bies.20441. Bioessays. 2006. PMID: 16927300 Review.
Cited by
-
An architecturally rational hemostat for rapid stopping of massive bleeding on anticoagulation therapy.Proc Natl Acad Sci U S A. 2024 Jan 30;121(5):e2316170121. doi: 10.1073/pnas.2316170121. Epub 2024 Jan 22. Proc Natl Acad Sci U S A. 2024. PMID: 38252814 Free PMC article.
-
CARD9-Associated Dectin-1 and Dectin-2 Are Required for Protective Immunity of a Multivalent Vaccine against Coccidioides posadasii Infection.J Immunol. 2020 Jun 15;204(12):3296-3306. doi: 10.4049/jimmunol.1900793. Epub 2020 May 1. J Immunol. 2020. PMID: 32358020 Free PMC article.
-
The Chitinases as Biomarkers for Amyotrophic Lateral Sclerosis: Signals From the CNS and Beyond.Front Neurol. 2020 May 27;11:377. doi: 10.3389/fneur.2020.00377. eCollection 2020. Front Neurol. 2020. PMID: 32536900 Free PMC article. Review.
-
A new synthetic toll-like receptor 1/2 ligand is an efficient adjuvant for peptide vaccination in a human volunteer.J Immunother Cancer. 2019 Nov 15;7(1):307. doi: 10.1186/s40425-019-0796-5. J Immunother Cancer. 2019. PMID: 31730025 Free PMC article.
-
Preparation of Defined Chitosan Oligosaccharides Using Chitin Deacetylases.Int J Mol Sci. 2020 Oct 22;21(21):7835. doi: 10.3390/ijms21217835. Int J Mol Sci. 2020. PMID: 33105791 Free PMC article. Review.
References
Publication types
MeSH terms
Substances
Grants and funding
LinkOut - more resources
Full Text Sources
Medical
Molecular Biology Databases
