. 2018 Oct 11;8(1):15168.
doi: 10.1038/s41598-018-33203-6.

Heat-stress triggers MAPK crosstalk to turn on the hyperosmotic response pathway

Affiliations

Heat-stress triggers MAPK crosstalk to turn on the hyperosmotic response pathway

Paula Dunayevich et al. Sci Rep. .

Abstract

Cells make decisions based on a combination of external and internal signals. In yeast, the high osmolarity response (HOG) is a mitogen-activated protein kinase (MAPK) pathway that responds to a variety of stimuli, and it is central to the general stress response. Here we studied the effect of heat-stress (HS) on HOG. Using live-cell reporters and genetics, we show that HS promotes Hog1 phosphorylation and Hog1-dependent gene expression, exclusively via the Sln1 phosphorelay branch, and that the strength of the activation is larger in yeast adapted to high external osmolarity. HS stimulation of HOG is indirect. First, we show that HS causes glycerol loss, necessary for HOG activation. Preventing glycerol efflux by deleting the glyceroporin FPS1 or its regulators RGC1 and ASK10/RGC2, or by increasing external glycerol, greatly reduced HOG activation. Second, we found that HOG stimulation by HS depended on the operation of a second MAPK pathway, the cell-wall integrity (CWI), a well-known mediator of HS, since inactivating Pkc1 or deleting the MAPK SLT2 greatly reduced HOG activation. Our data suggest that the main role of the CWI in this process is to stimulate glycerol loss. We found that in yeast expressing the constitutively open channel mutant (Fps1-Δ11), HOG activity was independent of Slt2. In summary, we suggest that HS causes a reduction in turgor due to the loss of glycerol and the accompanying water, and that this is what actually stimulates HOG. Thus, taken together, our findings highlight a central role for Fps1, and the metabolism of glycerol, in the communication between the yeast MAPK pathways, essential for survival and reproduction in changing environments.


Conflict of interest statement

The authors declare no competing interests.

Figures
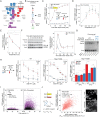
Figure 1
Figure 1
Heat-shock stimulates the HOG pathway. (A) The HOG pathway with its two branches (Sho1 in blue and Sln1 in red) converge on Pbs2, which phosphorylates and thus activates the MAPK Hog1. Active Hog1 translocates to the nucleus where it induces gene expression via the transcription factors Sko1, Skp1 (not shown), and Hot1. (B) Mating pheromone stimulates HOG indirectly. α factor activates the Cell Wall Integrity pathway, which in turn causes loss of glycerol through the aqua glyceroporin Fps1, leading to reduced turgor, and causing HOG activation. We hypothesize that heat-shock (HS) stimulates HOG via this route as well. This activating pathway is amplified in cells adapted to high osmolarity medium. (C) HOG transcriptional reporter dynamics following a shift from 30 °C to 37 °C in cells grown in SC or SC + 1M sorbitol. Plot shows HOG system output (population average of the total YFP accumulated in each cell) vs. time. (D) HOG system output of cells grown in SC + 1M sorbitol after 1 h of temperature shift from 30 °C to the indicated temperatures. (E) HOG activation by temperature shifts from the indicated temperatures to 37 °C in cells adapted to SC + 1M sorbitol. Plot shows HOG system output after 2 h of temperature shift. Colors correspond to replicate experiments. (F) HOG MAPK activation dynamics following a shift from 30 °C to 37 °C. Hog1 phosphorylation was assayed by immunoblotting. Left. Representative blot. Right. Plot of Hog1pp abundance. Uncropped blot in Fig. S3. (G) Same as in F but extracts were run in phos-tag polyacrylamide gels. We include a control of an extract from yeast grown in SC 5 minutes after addition of 0.5 M NaCl. Top. Representative blot. Bottom. Quantification showing fraction of phosphorylated Hog1 ± SEM. Uncropped blot in Fig. S4. (H) HOG system output in strains expressing WT Hog1, Hog1-T100A or Hog1-T100M mutants was measured after 2 h of temperature shift in the presence of the indicated concentration of 1NM-PP1. Statistical comparisons of left and middle plots are against the 0 μM 1NM-PP1 at the corresponding temperate. (I) Scatter plot comparing data at 0 vs. 120 minutes after temperature shift of cells grown in SC or SC + 1 M sorbitol. Plot shows HOG system output/area vs. area of individual cells. (J) Cell-to-cell variability in HOG activation. A strain with two identical STL1 promoters driving YFP or tdTomato grown in 1 M sorbitol medium after 1 h shift from 30 °C to 37 °C. Plot shows YFP vs. tdTomato protein reporters. ρ indicates Pearson correlation coefficient. Total variability is measured using η2tot (STD2(xFP/<xFP>)); intrinsic noise η2int (0.5 x STD2(YFP/<YFP> - tdTomato/<tdTomato>)) and η2ext2tot - η2int) (see Methods). Images show a representative field. Numbers mark selected cells from the plot. White bar corresponds to 5 μm. Strains: LD3342, RB3937, RB3938 and YGB5938. In panels C, D, E, F, G and H data correspond to the mean of three independent replicates (shown as dots) ± SEM.
Figure 2
Figure 2
Heat-shock activation of HOG depends on the Sln1 branch. (A) HOG MAPK activation dynamics following a shift from 30 °C to 37 °C in branch mutants in SC or in SC + 1 M sorbitol. Top. Representative blot. Uncropped blot in Fig. S7. (B) HOG transcriptional reporter in branch mutants measured 2 h after 1 M sorbitol-adapted cells were shifted from 30 °C to 37 °C. Values correspond to the mean of three independent replicates (shown as dots) ± SEM, relative to t0. Strains: LD3342, RB3382, RB3704, YPD5937, RB3642, RB3691 and RB3695.
Figure 3
Figure 3
Heat-shock activation of HOG depends on the Cell-Wall Integrity pathway. (A) HOG MAPK activation dynamics in WT and Δslt2 cells grown in SC or in SC + 1 M sorbitol following a shift from 30 °C to 37 °C. Left: representative blot. Uncropped blot in Fig. S3. Right. Hog1pp abundance. (B) HOG transcriptional reporter dynamics in WT and Δslt2 grown in SC + 1M sorbitol following a shift from 30 °C to 37 °C. (C) Scatter plot comparing data at time 0 with 120 minutes after temperature shift from 30 °C to 37 °C. (D) CWI MAPK activation dynamics following a shift from 30 °C to 37 °C in cells grown in SC or in SC + 1 M sorbitol. Slt2 phosphorylation was assayed by immunoblotting. Uncropped blot in Fig. S8. (E) HOG transcriptional reporter in the temperature sensitive mutant pkc1–3 measured 2 h after 1 M sorbitol-adapted cells were shifted from 24 °C to 37 °C. (F) HOG transcriptional reporter in yeast stimulated with 50 μg/ml of congo red or 50 μg/ml of calcofluor white. In A, B, E and F values correspond to the mean of three independent replicates ± SEM. Strains: LD3342, RB3376, YPD6020 and YPD6021.
Figure 4
Figure 4
Heat-shock activation of HOG involves efflux of glycerol. (A) HOG transcriptional reporter in WT, Δfps1 and Δrgc1Δrgc2 grown in SC + 1 M sorbitol measured 2 h after a shift from 30 °C to 37 °C. (B) Phos-tag gel showing HOG MAPK activation dynamics in WT, Δfps1 and Δrgc1Δrgc2 grown in SC + 1 M sorbitol following a shift from 30 °C to 37 °C, and a control of WT cells grown in SC stimulated with 0.5 M NaCl for 5 minutes. Left: representative blot. Middle. Fraction of phosphorylated Hog1. Right. Mean area under the curve (AUC) of phosphorylated Hog1 ± SEM. Uncropped blot in Fig. S11. (C) Intracellular glycerol measured in the indicated strains grown in 0.5 M NaCl after a shift from 26 °C to 37 °C. (D) Accumulated extracellular glycerol during 300 minutes of growth at 30 °C or after transfer to 37 °C of cells grown in SC + 1 M sorbitol. “a” p > 0.1 and “b” p < 0.05. (E) HOG transcriptional reporter in WT adapted to the indicated osmolarities at 30 °C and then transferred to 37 °C. Inset shows the increase in reporter due to the temperature shift relative to t0. (F) HOG MAPK activation dynamics in WT adapted to 1 M sorbitol or 1 M glycerol, grown at 30 °C and then transferred to 37 °C. Diagram. In medium with sorbitol, when Fps1 opens, glycerol will be lost from the cell. However, in medium with glycerol, even if Fps1 opens, the net glycerol flux should be zero. Left. Representative blot. Right. Phosphorylated Hog1 abundance. (G) HOG transcriptional reporter in WT adapted to the indicated mixtures of glycerol and sorbitol at 30 °C and then transferred to 37 °C. In all panels, data correspond to the mean of three independent replicates (shown as dots) ± SEM. Strains: LD3342, RB3396, RB3710, RB3717, RB3722, RB3376 and RB3382.
Figure 5
Figure 5
Constitutively open Fps1 bypasses the need of the CWI pathway. (A) HOG transcriptional reporter comparing WT and FPS1-Δ11 grown in SC or adapted to SC + 1 M sorbitol . Scatter plot shows HOG system output/area vs. cell area. (B) HOG transcriptional reporter in WT and FPS1-Δ11 grown in SC + 1 M sorbitol measured 2 h after a shift from 24 °C to 37 °C. Values correspond to the mean of three independent replicates (shown as points) ± SEM, relative to t0. (C) Same as in B for FPS1-Δ11, FPS1-Δ11 Δslt2 and FPS1-Δ11 Δssk2. Strains: LD3342, YPD6023, PAY6024 and PAY6025.
Figure 6
Figure 6
Model of HOG activation by heat-shock. Heat-shock stimulates glycerol efflux by at least two paths. One, independent of the glycerolporin Fps1, might be directly through the phospholipid bilayer. The other, Fps1-dependent, requires the activation of the CWI Pkc1-Slt2 pathway. Efflux increases when there is a large chemical gradient driving glycerol out, which happens when yeast grow in high osmolarity medium. Glycerol efflux causes reduced turgor pressure what in turn stimulates the Sln1 branch (Ssk1) of HOG. Activated Hog1 induces gene expression (PSTL1-YFP) and glycerol synthesis, which maintains a high chemical gradient, closing the circle.

Similar articles

Cited by

References

    1. Chen RE, Thorner J. Function and regulation in MAPK signaling pathways: lessons learned from the yeast Saccharomyces cerevisiae. Biochim Biophys Acta. 2007;1773:1311–1340. doi: 10.1016/j.bbamcr.2007.05.003. - DOI - PMC - PubMed
    1. Hohmann S. An integrated view on a eukaryotic osmoregulation system. Current genetics. 2015;61:373–382. doi: 10.1007/s00294-015-0475-0. - DOI - PubMed
    1. Levin DE. Regulation of cell wall biogenesis in Saccharomyces cerevisiae: the cell wall integrity signaling pathway. Genetics. 2011;189:1145–1175. doi: 10.1534/genetics.111.128264. - DOI - PMC - PubMed
    1. Atay O, Skotheim JM. Spatial and temporal signal processing and decision making by MAPK pathways. The Journal of cell biology. 2017;216:317–330. doi: 10.1083/jcb.201609124. - DOI - PMC - PubMed
    1. Madhani HD, Fink GR. The control of filamentous differentiation and virulence in fungi. Trends Cell Biol. 1998;8:348–353. doi: 10.1016/S0962-8924(98)01298-7. - DOI - PubMed

Publication types