. 2018 Nov 30;293(48):18613-18623.
doi: 10.1074/jbc.RA118.004891. Epub 2018 Oct 10.

Insulin and 20-hydroxyecdysone oppose each other in the regulation of phosphoinositide-dependent kinase-1 expression during insect pupation

Affiliations

Insulin and 20-hydroxyecdysone oppose each other in the regulation of phosphoinositide-dependent kinase-1 expression during insect pupation

Jing Pan et al. J Biol Chem. .

Abstract

Insulin promotes larval growth of insects by stimulating the synthesis of the steroid hormone 20-hydroxyecdysone (20E), which induces pupation and apoptosis. However, the mechanism underlying the coordinate regulation of insect pupation and apoptosis by these two functionally opposing hormones is still unclear. Here, using the lepidopteran insect and serious agricultural pest Helicoverpa armigera (cotton bollworm) as a model, we report that phosphoinositide-dependent kinase-1 (PDK1) and forkhead box O (FoxO) play key roles in these processes. We found that the transcript levels of the PDK1 gene are increased during the larval feeding stages. Moreover, PDK1 expression was increased by insulin, but repressed by 20E. dsRNA-mediated PDK1 knockdown in the H. armigera larvae delayed pupation and resulted in small pupae and also decreased Akt/protein kinase B expression and increased FoxO expression. Furthermore, the PDK1 knockdown blocked midgut remodeling and decreased 20E levels in the larvae. Of note, injecting larvae with 20E overcame the effect of the PDK1 knockdown and restored midgut remodeling. FoxO overexpression in an H. armigera epidermal cell line (HaEpi) did not induce apoptosis, but promoted autophagy and repressed cell proliferation. These results reveal cross-talk between insulin and 20E and that both hormones oppose each other's activities in the regulation of insect pupation and apoptosis by controlling PDK1 expression and, in turn, FoxO expression. We conclude that sufficiently high 20E levels are a key factor for inducing apoptosis during insect pupation.

Keywords: 20-hydroxyecdysone; FoxO; PDK; apoptosis; autophagy; bollworm; cell proliferation; insect development; insulin; protein kinase; pupation; steroid hormone.


Conflict of interest statement

The authors declare that they have no conflicts of interest with the contents of this article

Figures

Figure 1.
Figure 1.
qRT-PCR showing the expression profile and hormonal regulation of PDK1. A, expression profile of PDK1 in H. armigera larval tissues. 5 F, fifth-instar feeding larvae; 5 M, fifth-instar molting larvae; 6th-6h to 6th-120h, time stages of sixth-instar larvae; P0, pupation 0 h. B, expression of PDK1 in HaEpi cells by insulin (0.5–5 μg/ml) induction for 3 h. PBS was used as the solvent control. C, expression of PDK1 in HaEpi cells by insulin (2 μg/ml) induction (1–12 h). PBS was used as the solvent control. D, expression of PDK1 in HaEpi cells by 20E induction (1–5 μm for 6 h). E, expression of PDK1 in HaEpi cells by 20E (5 μm) induction (3–24 h). DMSO was used as the solvent control. F–I, hormonal regulation of the expression of PDK1 in the larval midgut. All of the experiments were performed in triplicate, and statistical analysis was conducted using Student's t test. Bars, mean ± S.D. The asterisks indicate the significant differences when compared with PBS or DMSO: *, p < 0.05; **, p < 0.01.
Figure 2.
Figure 2.
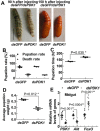
Knockdown of PDK1 delayed pupation time and decreased body weight. A, phenotypes after dsPDK1 or dsGFP injection (2 μg/6th-instar 6-h larva). Bar, 1 cm. B, analysis of the pupation rate and death rate by using Student's t test. Bars, mean ± S.D. based on three repeats, with 30 larvae in a repeat, respectively. C, time in which half of the larvae pupated after dsGFP or dsPDK1 injection. D, statistical analysis of average body weight of a pupa at day 1, individually weighed, after PDK1 knockdown by injection with dsGFP or dsPDK1. E, efficacy of PDK1 knockdown and transcript levels of Akt and FoxO in the larval midgut at 90 h after the first dsRNA injection. All of the experiments were performed in triplicate, and statistical analysis was conducted using Student's t test. Bars, mean ± S.D. *, p < 0.05; **, p < 0.01.
Figure 3.
Figure 3.
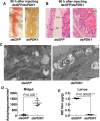
Knockdown of PDK1 in larvae repressed midgut remodeling and decreased 20E levels. A, midgut morphology after injection with dsGFP or dsPDK1 for 90 h. Bar, 1 cm. B, HE-stained midgut cross-slides after knockdown of PDK1, observed at 90 h after dsRNA injection. LM, larval midgut; IM, imaginal midgut. Bars, 10 μm. C, TEM observation after injection with dsGFP or dsPDK1 for 90 h in the midgut. Bars, 10 μm. D, statistical analysis of the autophagosomes in C by using Student's t test based on three independent replicates. We counted the autophagosomes according to the scale. E, 20E levels detected in larvae 90 h after injection with dsGFP or dsPDK1. All of the experiments were performed in triplicate, and statistical analysis was conducted using Student's t test based on three independent replicates. Bars, mean ± S.D. *, p < 0.05; **, p < 0.01.
Figure 4.
Figure 4.
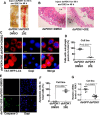
20E rescued the effect of PDK1 knockdown. A, morphology of the midgut after injection with dsPDK1 for 90 h and then injection with DMSO or 500 ng of 20E for 48 h. DMSO was used as the solvent control. Bar, 1 cm. B, histology of the midgut after the treatment mentioned in A. LM, larval midgut; IM, imaginal midgut. Bars, 10 μm. C, examination of autophagy in HaEpi after PDK1 knockdown by using TAT-RFP-LC3 to indicate the vesicles of autophagosomes. DMSO or 20E (5 μm) treatment for 72 h. Red, TAT RFP-LC3; blue, nucleus stained with Dapi; Merge, overlapping red and blue. Yellow bars, 20 μm. D, statistical analysis of C by using the data from 100 × 3 cells. The ratio between the cells in autophagy (red) to the total cells (blue) in the field view was obtained. E, examination of apoptosis in HaEpi cells after PDK1 knockdown by using the NucViewTM caspase-3 activity assay kit. Dapi stained the nucleus (blue fluorescence). Yellow bars, 50 μm. F, statistical analysis of E by using the data from 100 × 3 cells. The ratio of the cells in apoptosis (green) to the total cells (blue) in the field view was obtained. G, efficiency of interference in the HaEpi cell line. All of the experiments were performed in triplicate, and statistical analysis was conducted using Student's t test. Bars, mean ± S.D. **, p < 0.01.
Figure 5.
Figure 5.
Overexpression of FoxO induced autophagy. A, Western blotting showing the overexpression of GFP-His and FoxO-GFP-His in HaEpi cells for 48 h and DMSO or 20E (5 μm) treatment for 72 h. The SDS gel concentration was 12.5%; β-actin was used as the internal reference. B, Western blotting assay of LC3-I and LC3-II levels in HaEpi; β-actin was used as the internal reference. The SDS gel concentration was 12.5%. C, statistical analysis of B using Student's t test based on three independent replicates. D, micrograph of cells. Transfection with 2 μg of pIEx-RFP-LC3-His plasmid for 48 h to indicate autophagy before the treatments. RFP-LC3, RFP-LC3-His. Green, GFP-His or FoxO-GFP-His. Blue, nucleus stained with Dapi. Red, RFP-LC3 or RFP. Merge, overlapping red, green, and blue. Bar, 20 μm. E, statistical analysis of D by using the data from 100 × 3 cells. The ratio of the number of autophagy puncta to the number of cells (red cells) was obtained. All of the experiments were performed in triplicate, and statistical analysis was conducted using Student's t test. Bars, mean ± S.D. F, micrograph of cells for the negative control for D by overexpression of the RFP tag. Bar, 20 μm. *, p < 0.05.
Figure 6.
Figure 6.
Overexpression of FoxO could not induce apoptosis without 20E induction. A, Western blotting showing the overexpression of His tag and FoxO-His in HaEpi. SDS gel concentration was 12.5%. B, caspase-3 activity (green fluorescence) was detected using the NucViewTM caspase-3 activity assay kit after stimulation with DMSO or 20E (5 μm) for 72 h. Bar, 20 μm. Other treatments were the same as in A. There is no difference in FoxO overexpression in the presence/absence of 20E, and the effect of 20E is the same regardless of the overexpression of FoxO. C, statistical analysis of B by using the data from 100 cells. The ratio of the cells in apoptosis (green) to the total cells (white) in the field view was obtained by using Student's t test on the basis of three independent replicates. Bars, mean ± S.D. D, flow cytometry analysis of annexin V and PI staining after the same treatments as in A. Annexin V–FITC stained the earlier apoptotic cells by binding to the membrane phosphatidylserine, and PI indicated the later apoptotic cells and dead cells by entering the cells. R1, normal cells; R2, early apoptotic cells; R3, middle and late apoptotic cells; R4, dead cells. The numbers in the figure represent the percentage of apoptotic cells. E, statistical analysis of D. All of the experiments were performed in triplicate, and statistical analysis was conducted using Student's t test. Bars, mean ± S.D. *, p < 0.05.
Figure 7.
Figure 7.
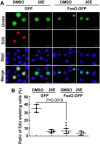
Overexpression of FoxO repressed cell proliferation. A, overexpression of GFP-His and FoxO-GFP-His in HaEpi cells and detection of cell proliferation by EdU. Green, GFP-His or FoxO-GFP-His. β-Actin was used as the internal reference. Cells were treated with 20E (5 μm) for 72 h. The same volume of DMSO was used as the control. Blue, nucleus stained with Dapi. Red, EdU. Merge, overlapping red, green, and blue. Bar, 20 μm. B, statistical analysis of A by using the data from 100 × 3 cells. All of the experiments were performed in triplicate, and statistical analysis was conducted using Student's t test. Bars, mean ± S.D. **, p < 0.01.
Figure 8.
Figure 8.
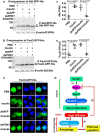
PDK1 is involved in the insulin pathway. A and B, insulin, via PDK1, induces Akt and FoxO phosphorylation. The cells were transfected with Akt-RFP-His or FoxO-GFP-His for 48 h and then transfected with 2 μg of dsGFP or dsPDK1. Insulin (5 μg/ml) was added to the cells in Dulbecco's PBS for 1 h. 7.5% SDS-PAGE was performed, with β-actin as the control. P-Akt-RFP-His and P-FoxO-GFP-His are the phosphorylated forms of the proteins, respectively. a and b, statistical analysis of A and B. Akt-P, P-Akt-RFP-His; FoxO-P, P-FoxO-GFP-His. All experiments were performed in triplicate, and statistical analysis was conducted using Student's t test. Bars, mean ± S.D. C, PDK1 knockdown blocked insulin-induced FoxO cytoplasmic translocation. Green fluorescence indicates FoxO-GFP-His. Blue, nuclei (Dapi). Scale bars, 20 μm. D, explanation for the regulation of pupation by insulin and 20E via counteractive regulation of PDK1 expression. 1, insulin up-regulates PDK1 expression, which induces Akt phosphorylation. Akt induces FoxO phosphorylation and cytosol localization to allow cell proliferation and high titer of 20E production. 2, high 20E titer represses PDK1 mRNA levels by an unknown negative feedback mechanism and therefore represses Akt and FoxO phosphorylation, resulting in FoxO nuclear localization. 3, FoxO in the nucleus induces autophagy and represses cell proliferation. 4, 20E promotes autophagy transformed to apoptosis in the midgut during metamorphosis by increasing cellular calcium (34, 53, 66). High 20E titer functions as a switch between growth and metamorphosis. Akt-P, phosphorylated Akt. FoxO-P, phosphorylated FoxO. PCD, programmed cell death. *, p < 0.05; **, p < 0.01.

Similar articles

Cited by

References

    1. Umezaki Y., Hayley S. E., Chu M. L., Seo H. W., Shah P., and Hamada F. N. (2018) Feeding-state-dependent modulation of temperature preference requires insulin signaling in Drosophila warm-sensing neurons. Curr. Biol. 28, 779–787.e3 10.1016/j.cub.2018.01.060 - DOI - PMC - PubMed
    1. Mizoguchi A., and Okamoto N. (2013) Insulin-like and IGF-like peptides in the silkmoth Bombyx mori: discovery, structure, secretion, and function. Front. Physiol. 4, 217 - PMC - PubMed
    1. Nagasawa H., Kataoka H., Isogai A., Tamura S., Suzuki A., Ishizaki H., Mizoguchi A., Fujiwara Y., and Suzuki A. (1984) Amino-terminal amino acid sequence of the silkworm prothoracicotropic hormone: homology with insulin. Science 226, 1344–1345 10.1126/science.226.4680.1344 - DOI - PubMed
    1. Nässel D. R., and Vanden Broeck J. (2016) Insulin/IGF signaling in Drosophila and other insects: factors that regulate production, release and post-release action of the insulin-like peptides. Cell. Mol. Life Sci. 73, 271–290 10.1007/s00018-015-2063-3 - DOI - PMC - PubMed
    1. Brogiolo W., Stocker H., Ikeya T., Rintelen F., Fernandez R., and Hafen E. (2001) An evolutionarily conserved function of the Drosophila insulin receptor and insulin-like peptides in growth control. Curr. Biol. 11, 213–221 10.1016/S0960-9822(01)00068-9 - DOI - PubMed

Publication types

MeSH terms