Ezrin, a Membrane Cytoskeleton Cross-Linker Protein, as a Marker of Epithelial Damage in Asthma
- PMID: 30290132
- PMCID: PMC6376623
- DOI: 10.1164/rccm.201802-0373OC
Ezrin, a Membrane Cytoskeleton Cross-Linker Protein, as a Marker of Epithelial Damage in Asthma
Abstract
Rationale: Bronchial epithelial cell damage occurs in patients with bronchial asthma. Ezrin, a membrane-cytoskeleton protein, maintains cellular morphology and intercellular adhesion and protects the barrier function of epithelial cells.
Objectives: To study the role of ezrin in bronchial epithelial cells injury and correlate its expression with asthma severity.
Methods: Levels of ezrin were measured in exhaled breath condensate (EBC) and serum in patients with asthma and BAL fluid (BALF) from a mouse model of asthma by ELISA. The regulation of IL-13 on ezrin protein levels was studied in primary bronchial epithelial cells. Ezrin knockdown using shRNA was studied in human bronchial epithelial 16HBE cells.
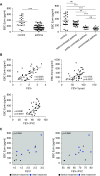
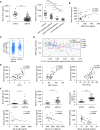
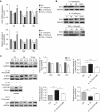
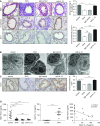
Measurements and main results: Ezrin levels were decreased in asthmatic EBC (92.7 ± 34.99 vs. 150.5 ± 10.22 pg/ml, P < 0.0001) and serum (700.7 ± 55.59 vs. 279.2 ± 25.83 pg/ml, P < 0.0001) compared with normal subjects. Levels were much lower in uncontrolled (P < 0.001) and partly controlled patients (P < 0.01) compared with well-controlled subjects. EBC and serum ezrin levels correlated with lung function in patients with asthma and serum ezrin levels were negatively correlated with serum IL-13 and periostin. IL-13-induced downregulation of ezrin expression in primary bronchial epithelial cells was significantly attenuated by the Janus tyrosine kinase 2 inhibitor, TG101348. Ezrin knockdown changed 16HBE cell morphology, enlarged intercellular spaces, and increased their permeability. Ezrin expression was decreased in the lung tissue and BALF of "asthmatic" mice and negatively correlated with BALF IL-13 level.
Conclusions: Ezrin downregulation is associated with IL-13-induced epithelial damage and might be a potential biomarker of asthma control.
Keywords: IL-13; biomarker; bronchial asthma; bronchial epithelial cells.
Figures


Comment in
-
Ezrin in Asthma: A First Step to Early Biomarkers of Airway Epithelial Dysfunction.Am J Respir Crit Care Med. 2019 Feb 15;199(4):408-410. doi: 10.1164/rccm.201810-1964ED. Am J Respir Crit Care Med. 2019. PMID: 30383410 No abstract available.
Similar articles
-
Comparative study of periostin expression in different respiratory samples in patients with asthma and chronic obstructive pulmonary disease.Pol Arch Med Wewn. 2016;126(3):124-37. doi: 10.20452/pamw.3299. Epub 2016 Feb 19. Pol Arch Med Wewn. 2016. PMID: 26895432
-
Serum levels of epithelial-derived mediators and interleukin-4/interleukin-13 signaling after bronchial challenge with Dermatophagoides pteronyssinus in patients with allergic asthma.Scand J Immunol. 2019 Nov;90(5):e12820. doi: 10.1111/sji.12820. Epub 2019 Oct 7. Scand J Immunol. 2019. PMID: 31486098
-
KIF3A knockdown sensitizes bronchial epithelia to apoptosis and aggravates airway inflammation in asthma.Biomed Pharmacother. 2018 Jan;97:1349-1355. doi: 10.1016/j.biopha.2017.10.160. Epub 2017 Nov 15. Biomed Pharmacother. 2018. PMID: 29156524
-
Tissue factor promotes airway pathological features through epithelial-mesenchymal transition of bronchial epithelial cells in mice with house dust mite-induced asthma.Int Immunopharmacol. 2021 Aug;97:107690. doi: 10.1016/j.intimp.2021.107690. Epub 2021 Apr 30. Int Immunopharmacol. 2021. PMID: 33940323
-
CCL11 as a potential diagnostic marker for asthma?J Asthma. 2014 Oct;51(8):847-54. doi: 10.3109/02770903.2014.917659. Epub 2014 May 13. J Asthma. 2014. PMID: 24796647 Review.
Cited by
-
Airway acidification impaired host defense against Pseudomonas aeruginosa infection by promoting type 1 interferon β response.Emerg Microbes Infect. 2022 Dec;11(1):2132-2146. doi: 10.1080/22221751.2022.2110524. Emerg Microbes Infect. 2022. PMID: 35930458 Free PMC article.
-
Store-operated calcium entry enhances the polarization and chemotaxis of neutrophils in the peripheral venous blood of patients with bronchial asthma by upregulating ERM protein.J Thorac Dis. 2023 Apr 28;15(4):2051-2067. doi: 10.21037/jtd-23-467. J Thorac Dis. 2023. PMID: 37197551 Free PMC article.
-
Function of cAMP scaffolds in obstructive lung disease: Focus on epithelial-to-mesenchymal transition and oxidative stress.Br J Pharmacol. 2019 Jul;176(14):2402-2415. doi: 10.1111/bph.14605. Epub 2019 Mar 18. Br J Pharmacol. 2019. PMID: 30714124 Free PMC article. Review.
-
Differences in Inflammatory Cytokine Profile in Obesity-Associated Asthma: Effects of Weight Loss.J Clin Med. 2022 Jun 29;11(13):3782. doi: 10.3390/jcm11133782. J Clin Med. 2022. PMID: 35807067 Free PMC article.
-
Respiratory Effects of Traffic-Related Air Pollution: A Randomized, Crossover Analysis of Lung Function, Airway Metabolome, and Biomarkers of Airway Injury.Environ Health Perspect. 2023 May;131(5):57002. doi: 10.1289/EHP11139. Epub 2023 May 4. Environ Health Perspect. 2023. PMID: 37141245 Free PMC article. Clinical Trial.
References
-
- Bousquet J, Mantzouranis E, Cruz AA, Aït-Khaled N, Baena-Cagnani CE, Bleecker ER, et al. Uniform definition of asthma severity, control, and exacerbations: document presented for the World Health Organization Consultation on Severe Asthma. J Allergy Clin Immunol. 2010;126:926–938. - PubMed
-
- Cohn L, Elias JA, Chupp GL. Asthma: mechanisms of disease persistence and progression. Annu Rev Immunol. 2004;22:789–815. - PubMed
-
- Holgate ST, Roberts G, Arshad HS, Howarth PH, Davies DE. The role of the airway epithelium and its interaction with environmental factors in asthma pathogenesis. Proc Am Thorac Soc. 2009;6:655–659. - PubMed
-
- Xiao C, Puddicombe SM, Field S, Haywood J, Broughton-Head V, Puxeddu I, et al. Defective epithelial barrier function in asthma. J Allergy Clin Immunol. 2011;128:549–56.e1, 12. - PubMed
Publication types
MeSH terms
Substances
Grants and funding
LinkOut - more resources
Full Text Sources
Medical
Miscellaneous

