

Repurposing of promoters and enhancers during mammalian evolution
- PMID: 30287902
- PMCID: PMC6172195
- DOI: 10.1038/s41467-018-06544-z
Repurposing of promoters and enhancers during mammalian evolution
Abstract
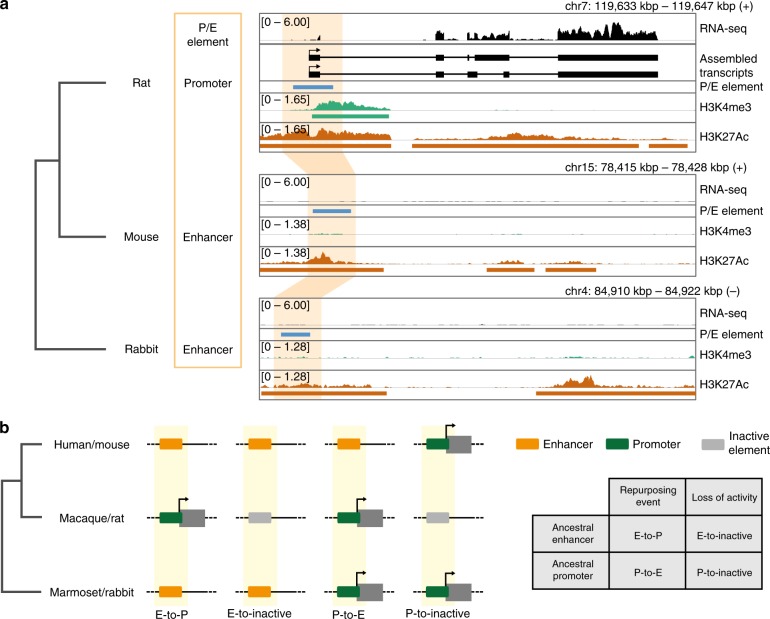
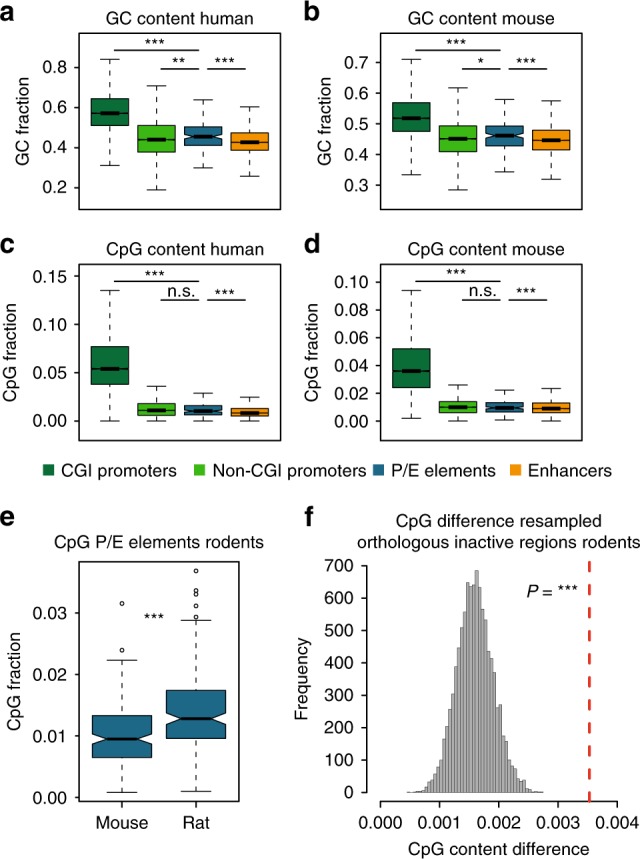
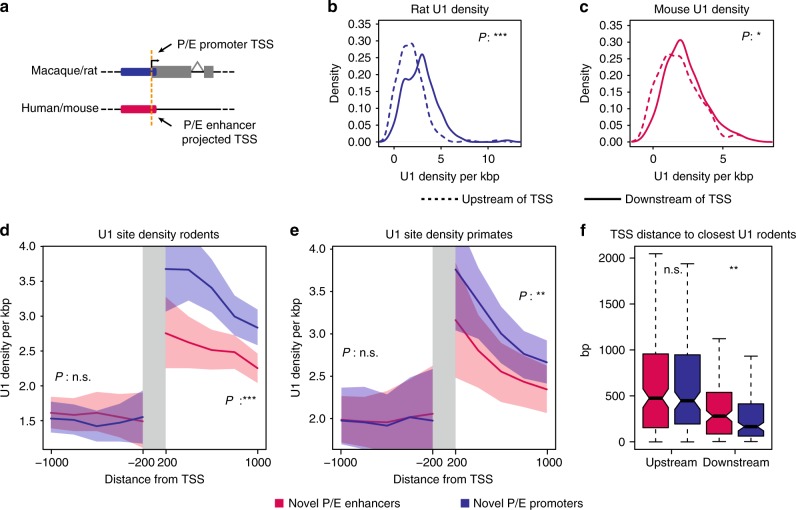
Promoters and enhancers-key controllers of gene expression-have long been distinguished from each other based on their function. However, recent work suggested that common architectural and functional features might have facilitated the conversion of one type of element into the other during evolution. Here, based on cross-mammalian analyses of epigenome and transcriptome data, we provide support for this hypothesis by detecting 445 regulatory elements with signatures of activity turnover (termed P/E elements). Most events represent transformations of putative ancestral enhancers into promoters, leading to the emergence of species-specific transcribed loci or 5' exons. Distinct GC sequence compositions and stabilizing 5' splicing (U1) regulatory motif patterns may have predisposed P/E elements to regulatory repurposing, and changes in the U1 and polyadenylation signal densities and distributions likely drove the evolutionary activity switches. Our work suggests that regulatory repurposing facilitated regulatory innovation and the origination of new genes and exons during evolution.
Conflict of interest statement
The authors declare no competing interests.
Figures

Similar articles
-
Evolution of Regulated Transcription.Cells. 2020 Jul 12;9(7):1675. doi: 10.3390/cells9071675. Cells. 2020. PMID: 32664620 Free PMC article. Review.
-
Cis and trans effects differentially contribute to the evolution of promoters and enhancers.Genome Biol. 2020 Aug 20;21(1):210. doi: 10.1186/s13059-020-02110-3. Genome Biol. 2020. PMID: 32819422 Free PMC article.
-
The life history of retrocopies illuminates the evolution of new mammalian genes.Genome Res. 2016 Mar;26(3):301-14. doi: 10.1101/gr.198473.115. Epub 2016 Jan 4. Genome Res. 2016. PMID: 26728716 Free PMC article.
-
LINE retrotransposons characterize mammalian tissue-specific and evolutionarily dynamic regulatory regions.Genome Biol. 2021 Feb 18;22(1):62. doi: 10.1186/s13059-021-02260-y. Genome Biol. 2021. PMID: 33602314 Free PMC article.
-
Evaluating Enhancer Function and Transcription.Annu Rev Biochem. 2020 Jun 20;89:213-234. doi: 10.1146/annurev-biochem-011420-095916. Epub 2020 Mar 20. Annu Rev Biochem. 2020. PMID: 32197056 Review.
Cited by
-
Evolution of Regulated Transcription.Cells. 2020 Jul 12;9(7):1675. doi: 10.3390/cells9071675. Cells. 2020. PMID: 32664620 Free PMC article. Review.
-
Harnessing natural variation to identify cis regulators of sex-biased gene expression in a multi-strain mouse liver model.PLoS Genet. 2021 Nov 9;17(11):e1009588. doi: 10.1371/journal.pgen.1009588. eCollection 2021 Nov. PLoS Genet. 2021. PMID: 34752452 Free PMC article.
-
Epromoters function as a hub to recruit key transcription factors required for the inflammatory response.Nat Commun. 2021 Nov 18;12(1):6660. doi: 10.1038/s41467-021-26861-0. Nat Commun. 2021. PMID: 34795220 Free PMC article.
-
CpG Methylation Levels in HPA Axis Genes Predict Chronic Pain Outcomes Following Trauma Exposure.J Pain. 2023 Jul;24(7):1127-1141. doi: 10.1016/j.jpain.2023.03.001. Epub 2023 Mar 10. J Pain. 2023. PMID: 36906051 Free PMC article.
-
Non-Human Primate iPSC Generation, Cultivation, and Cardiac Differentiation under Chemically Defined Conditions.Cells. 2020 May 29;9(6):1349. doi: 10.3390/cells9061349. Cells. 2020. PMID: 32485910 Free PMC article.
References
Publication types
MeSH terms
Grants and funding
LinkOut - more resources
Full Text Sources
Molecular Biology Databases
Miscellaneous
