. 2018 Oct 4;19(1):152.
doi: 10.1186/s13059-018-1504-3.

Predicting microRNA targeting efficacy in Drosophila

Affiliations

Predicting microRNA targeting efficacy in Drosophila

Vikram Agarwal et al. Genome Biol. .

Abstract

Background: MicroRNAs (miRNAs) are short regulatory RNAs that derive from hairpin precursors. Important for understanding the functional roles of miRNAs is the ability to predict the messenger RNA (mRNA) targets most responsive to each miRNA. Progress towards developing quantitative models of miRNA targeting in Drosophila and other invertebrate species has lagged behind that of mammals due to the paucity of datasets measuring the effects of miRNAs on mRNA levels.

Results: We acquired datasets suitable for the quantitative study of miRNA targeting in Drosophila. Analyses of these data expanded the types of regulatory sites known to be effective in flies, expanded the mRNA regions with detectable targeting to include 5' untranslated regions, and identified features of site context that correlate with targeting efficacy in fly cells. Updated evolutionary analyses evaluated the probability of conserved targeting for each predicted site and indicated that more than a third of the Drosophila genes are preferentially conserved targets of miRNAs. Based on these results, a quantitative model was developed to predict targeting efficacy in insects. This model performed better than existing models, and it drives the most recent version, v7, of TargetScanFly.

Conclusions: Our evolutionary and functional analyses expand the known scope of miRNA targeting in flies and other insects. The existence of a quantitative model that has been developed and trained using Drosophila data will provide a valuable resource for placing miRNAs into gene regulatory networks of this important experimental organism.

Keywords: Non-coding RNAs; Post-transcriptional gene regulation; miRNA target prediction.


Conflict of interest statement

Ethics approval

Not applicable.

Consent for publication

Not applicable.

Competing interests

The authors declare that they have no competing interests.

Publisher’s Note

Springer Nature remains neutral with regard to jurisdictional claims in published maps and institutional affiliations.

Figures

Fig. 1
Fig. 1
Drosophila miRNAs mediate mRNA repression through the targeting of canonical site types, preferentially in 3′ UTRs. a The increased efficacy in Drosophila of sites with an A across from miRNA position 1. Shown is the response of mRNAs to the transfection of a miRNA (either miR-1, miR-4, miR-92a, miR-124, miR-263a, or miR-994). Data were pooled across these six independent experiments. Plotted are cumulative distributions of mRNA fold changes observed upon miRNA transfection for mRNAs that contained a single site of the indicated type to the transfected miRNA. The site types compared are 8mers that perfectly match miRNA positions 2–7 and have the specified nucleotide (A, C, G, or U) across from position 1 of the miRNA. Also plotted for comparison is the cumulative distribution of mRNA fold changes for mRNAs that did not contain a canonical 7- or 8-nt site to the transfected RNA in their 3′ UTR (no site). Similarity of site-containing distributions to the no-site distribution was tested with the one-sided Kolmogorov–Smirnov (K–S) test (P values). Shown in parentheses are the numbers of mRNAs analyzed in each category. b The six canonical site types for which a signal for repression was detected after transfecting a miRNA into Drosophila cells. ce The efficacy of the canonical site types observed in Drosophila 3′ UTRs (c), ORFs (d), and 5′ UTRs (e). These panels are as in a, but compare fold-change distributions for mRNAs possessing a single canonical site in the indicated region to those with no canonical sites in the entirety of the mRNA. See also Additional file 2: Figures S1 and S2
Fig. 2
Fig. 2
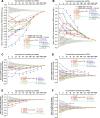
Evolutionary conservation of canonical sites in Drosophila 5′ UTRs and 3′ UTRs. a Phylogenetic tree of the 27 species used to examine miRNA site conservation. Outgroups of the genus Drosophila include Musca domestica (the housefly), Anopheles gambiae (the mosquito), Apis mellifera (the European honey bee), and Tribolium castaneum (the red flour beetle). D. melanogaster 3′ UTRs were assigned to one of five conservation bins based upon the median conservation of nucleotides across the entire 3′ UTR. The tree is drawn using the branch lengths and topology reported from genome-wide alignments in the UCSC Genome Browser. To the left of the tree, are color-coded branch-length scores corresponding to a site conserved among an entire subgroup of species indicated by a bar of the same color, showing scores for a site within a 3′ UTR in the lowest, middle, and highest conservation bins, labeled in parentheses as bins 1, 3, or 5, respectively. b, c Signal-to-background ratios for indicated site types at increasing branch-length cutoffs, computed for sites located in 3′ UTRs (b) or 5′ UTRs (c). Broken lines indicate 5% lower confidence limits (z-test). These panels were modeled after the one originally shown for the analysis of mammalian 3′ UTR sites [57]. d, e Signal above background for indicated site types at increasing branch-length cutoffs, computed for sites located in 3′ UTRs (d) or 5′ UTRs (e). Broken lines indicate 5% lower confidence limits (z-test). These panels were modeled after the one originally shown for the analysis of mammalian 3′ UTR sites [57]. f Signal-to-background ratios for the 8mer sites of 91 conserved miRNA seed families, calculated at near optimal sensitivity (a branch-length cutoff of 1.0), comparing the ratios observed for sites in 5′ UTRs to those for sites in 3′ UTRs (rs Spearman correlation). Seed families conserved since the ancestor of bilaterian animals are distinguished from those that emerged more recently (orange and blue, respectively). Boxplots on the sides show the distributions of ratios for these two sets of families, with statistical significance for differences in these distributions evaluated using the one-sided Wilcoxon rank-sum test (*P < 0.01). See also Additional file 4: Table S3. g Relationship between site conservation rate and repression efficacy. The fraction of sites conserved above background was calculated as ([Signal – Background]/Signal) at a branch-length cutoff of 1.0. The minimal fraction of sites conferring destabilization was determined from the cumulative distributions (e.g., those in Additional file 2: Figure S2), considering the maximal vertical displacement from the no-site distribution (error bars, standard deviation, n = 6 miRNAs). Colors and shapes represent the canonical site types and UTR location, respectively. This panel was modeled after the one originally shown for the analysis of mammalian 3′ UTR sites [57]. h Relationship between site efficacy and site PCT. mRNAs were selected to have either one 7mer-A1, one 7mer-m8, or one 8mer 3′ UTR site to the transfected miRNA and no other canonical 3′ UTR site. mRNAs with sites of each type were grouped into six equal bins based on the site PCT. For each bin, mean mRNA fold change in the transfection data (error bars, standard error) is plotted with respect to the mean PCT, with the dashed lines showing the least-squares fit to the data. The slopes for each are negative and significantly different from zero (P value < 10− 10, linear regression using unbinned data)
Fig. 3
Fig. 3
Refinement of 3′ UTR annotations in S2 cells and development of a regression model that predicts miRNA targeting efficacy in Drosophila. a Poly(A) sites detected in S2 cells by 3P-seq, classified with respect to their previous annotation status. b Extension and contraction of longest 3′ UTR isoforms relative to the FlyBase annotations. For each gene with a poly(A) site detected using 3P-seq, the difference between the longest 3′ UTR isoform annotated using 3P-seq was compared to longest 3′ UTR isoform annotated at FlyBase. These differences were then binned as indicated, and the number of sites assigned to each bin is plotted. c Optimization of scoring of predicted 3′ supplementary pairing in flies. Predicted thermodynamic energy scores were computed for the pairing between a 9-nt region upstream of canonical 7–8-nt 3′UTR sites and a variable-length region of the miRNA with the indicated size (window size) that began at the indicated position of the miRNA. The heatmap displays the partial correlations between these scores and the repression associated with the corresponding sites, determined while controlling for site type. d Optimization of the scoring of predicted structural accessibility in flies. Predicted RNA structural accessibility scores were computed as the average pairing probabilities for variable-length (window size) regions that centered at the indicated mRNA position, shown with respect to the seed match of each canonical 7–8-nt 3′ UTR site. The heatmap displays the partial correlations between these values and the repression associated with the corresponding sites, determined while controlling for site type. e The contributions of site type and each of the six features of the context model. For each site type, the coefficients for the multiple linear regression are plotted for each feature. Because features were each scored on a similar scale, the relative contribution of each feature in discriminating between more or less effective sites was roughly proportional to the absolute value of its coefficient. Also plotted are the intercepts, which roughly indicate the discriminatory power of site type. Bars indicate the 95% confidence intervals of each coefficient. See also Additional file 2: Table S4, Table S5, and Figure S3A
Fig. 4
Fig. 4
Performances of different target-prediction algorithms in flies. a The differential ability of algorithms to predict the mRNAs most responsive to miRNAs transfected into Drosophila cells. Shown for each algorithm in the key are mean mRNA fold changes observed for top-ranked predicted targets, evaluated over a sliding sensitivity threshold using the six miRNA transfection datasets. Some methods, such as PicTar, which generated relatively few predictions, could be evaluated at only a few thresholds, whereas others, such as RNA22 and TargetSpy, could be evaluated at many more. For each algorithm, predictions for each of the six miRNAs were ranked according to their scores, and the mean fold-change values were plotted at each sensitivity threshold. For example, at a threshold of 16, the 16 top predictions for each miRNA were identified (not considering predictions for mRNAs expressed too low to be accurately quantified). mRNA fold-change values for these predictions were collected from the cognate transfections, and the mean fold-change values were computed for each transfection for which the threshold did not exceed the number of reported predictions. The mean of the available mean values was then plotted. Also plotted are the mean of mean mRNA fold changes for all mRNAs with at least one cognate canonical 7–8-nt site in their 3′ UTR (dashed line), the mean of mean fold change for all mRNAs with at least one conserved cognate canonical 7–8-nt site in their 3′ UTR (dotted line) and the 95% confidence interval for the mean fold changes of randomly selected mRNAs, determined using 1000 resamplings (without replacement) at each cutoff (shading). Sites were considered conserved if their branch-length scores exceeded a cutoff with a signal:background ratio of 2:1 for the corresponding site type (cutoffs of 1.0, 1.6, and 1.6 for 8mer, 7mer-m8, and 7mer-A1 sites, respectively; Fig. 2b). Thresholds at which the distribution of fold changes for predicted targets of the context model was significantly greater than that of any other model are indicated (*, one-sided Wilcoxon rank-sum test, P value < 0.05). See also Additional file 2: Figure S4. b The differential ability of algorithms to predict the mRNAs most responsive to knocking out miRNAs in flies. Shown for each algorithm in the key are mean mRNA fold changes observed for top-ranked predicted targets, evaluated over a sliding sensitivity threshold using the three knockout datasets. Otherwise, this panel is as in a. c and d The differential ability of algorithms to predict targets that respond to the miRNA despite lacking a canonical 7–8-nt 3′ UTR site. These panels are as in a and b, except they plot results for only the predicted targets that lack a canonical 7–8-nt site in their 3′ UTR. Results for our context model and other algorithms that only predict targets with canonical 7–8-nt 3′ UTR sites are not shown. Instead, results are shown for a 6mer context model, which considers only the additive effects of 6mer, offset 6mer, and 6mer-A1 sites and their corresponding context features. e and f The difficulty of predicting mRNAs that respond to miRNA transfection or knockout despite lacking canonical 6–8-nt 3′ UTR sites. These panels are as in c and d, respectively, except they plot results for mRNAs with 3′ UTRs that lack a canonical 6–8-nt site
Fig. 5
Fig. 5
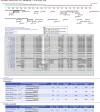
An example of a TargetScanFly page, which displays the predicted sites of conserved miRNAs within the Ubx 3′ UTR. At the top is the 3′ UTR profile, showing the relative expression of tandem 3′ UTR isoforms, as measured using 3′-seq [74] as well as our 3P-seq data. Shown on this profile is the end of the longest FlyBase annotation (blue vertical line) and the number of 3′-end reads (525) used to generate the profile (labeled on the y-axis). Below the profile are conserved and poorly conserved sites for miRNAs broadly conserved among insects (colored according to the key), with options to also display sites for poorly conserved miRNAs and other miRBase annotations. Boxed are the predicted miR-iab-8 sites, with the site selected by the user indicated with a darker box. The multiple sequence alignment shows the species in which an orthologous site can be detected (white highlighting) among 27 insect species. Below the alignment is the predicted consequential pairing between the selected miRNA and its conserved and poorly conserved sites, showing also for each site its position, site type, context score, context score percentile, weighted context score, branch-length score, and PCT score

Similar articles

Cited by

References

    1. Bartel DP. MicroRNAs: genomics, biogenesis, mechanism, and function. Cell. 2004;116:281–297. doi: 10.1016/S0092-8674(04)00045-5. - DOI - PubMed
    1. Forstemann K, Horwich MD, Wee L, Tomari Y, Zamore PD. Drosophila microRNAs are sorted into functionally distinct argonaute complexes after production by dicer-1. Cell. 2007;130:287–297. doi: 10.1016/j.cell.2007.05.056. - DOI - PMC - PubMed
    1. Tomari Y, Du T, Zamore PD. Sorting of Drosophila small silencing RNAs. Cell. 2007;130:299–308. doi: 10.1016/j.cell.2007.05.057. - DOI - PMC - PubMed
    1. Lai EC. Micro RNAs are complementary to 3' UTR sequence motifs that mediate negative post-transcriptional regulation. Nat Genet. 2002;30:363–364. doi: 10.1038/ng865. - DOI - PubMed
    1. Bartel DP. MicroRNAs: target recognition and regulatory functions. Cell. 2009;136:215–233. doi: 10.1016/j.cell.2009.01.002. - DOI - PMC - PubMed

Publication types

LinkOut - more resources