. 2018 Oct 4;3(19):e122673.
doi: 10.1172/jci.insight.122673.

Dual TLR2 and TLR7 agonists as HIV latency-reversing agents

Affiliations

Dual TLR2 and TLR7 agonists as HIV latency-reversing agents

Amanda B Macedo et al. JCI Insight. .

Abstract

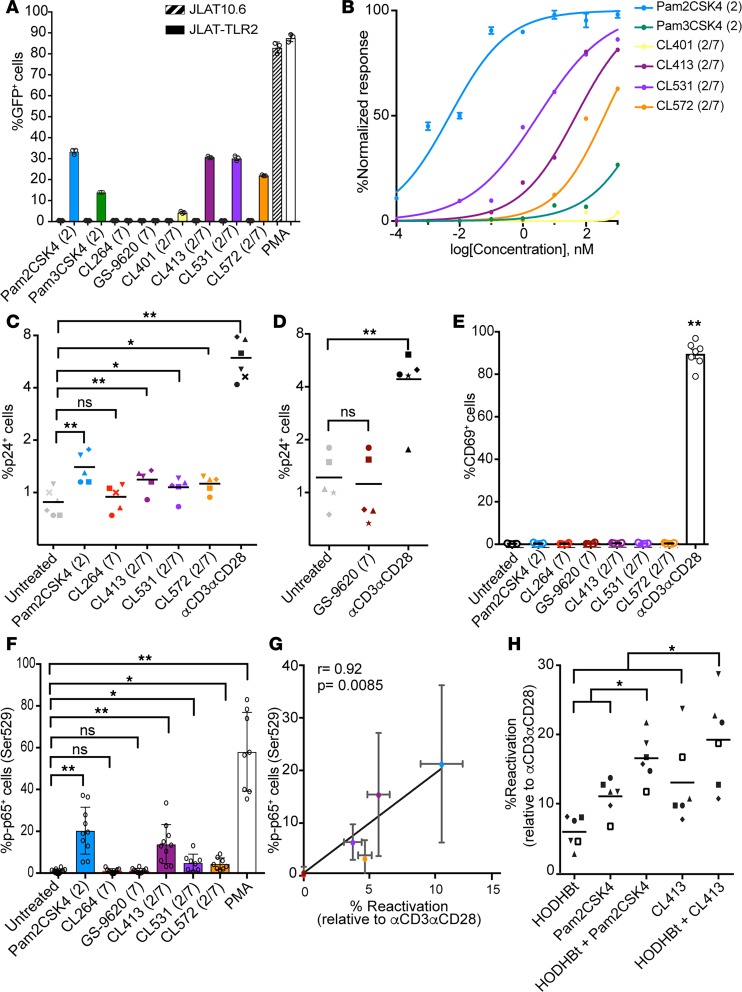
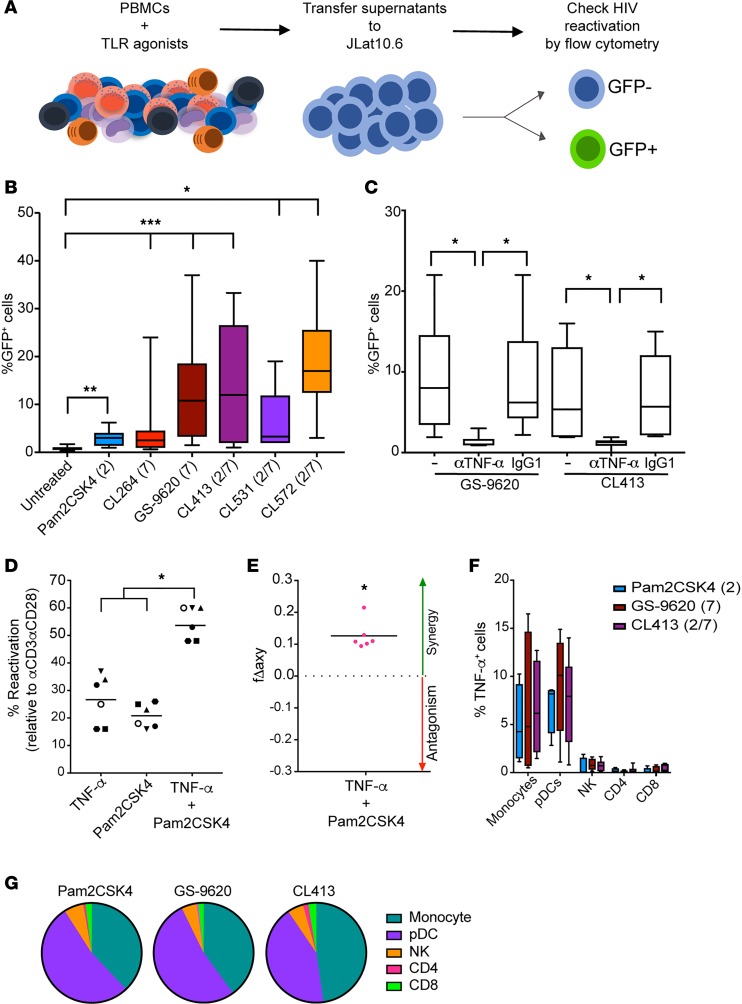
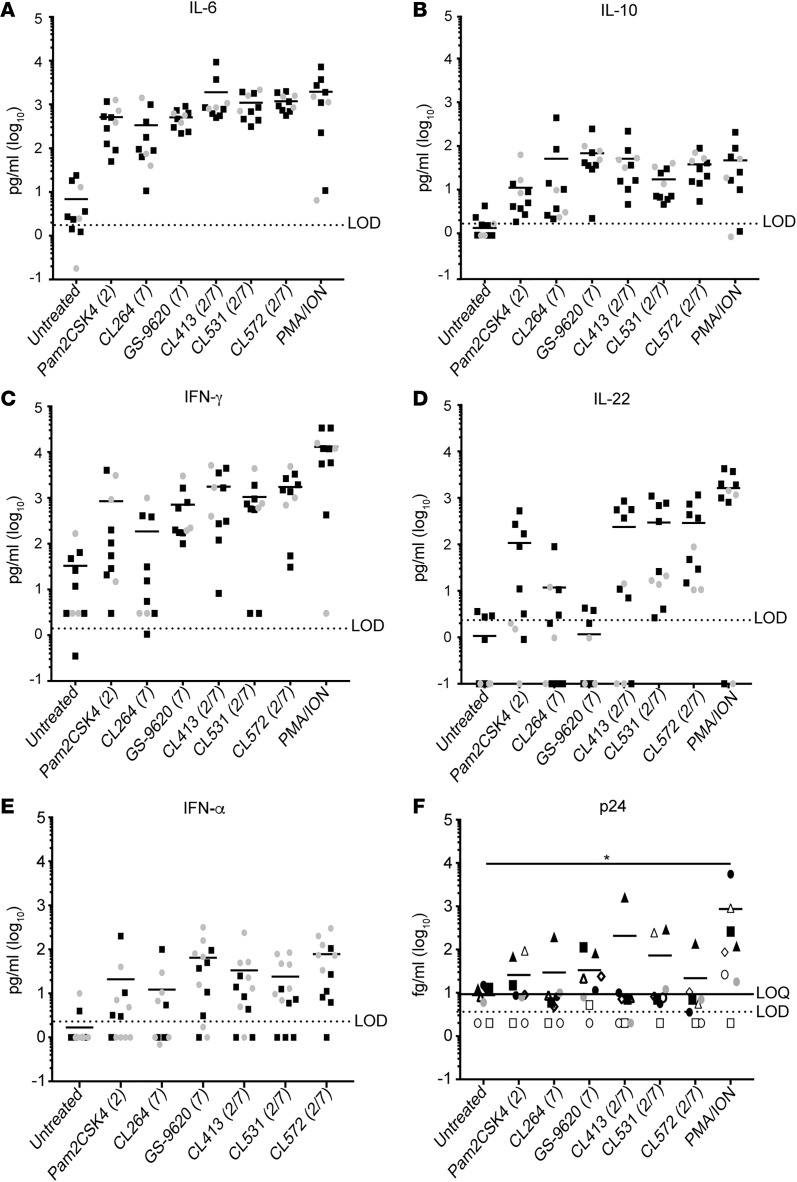
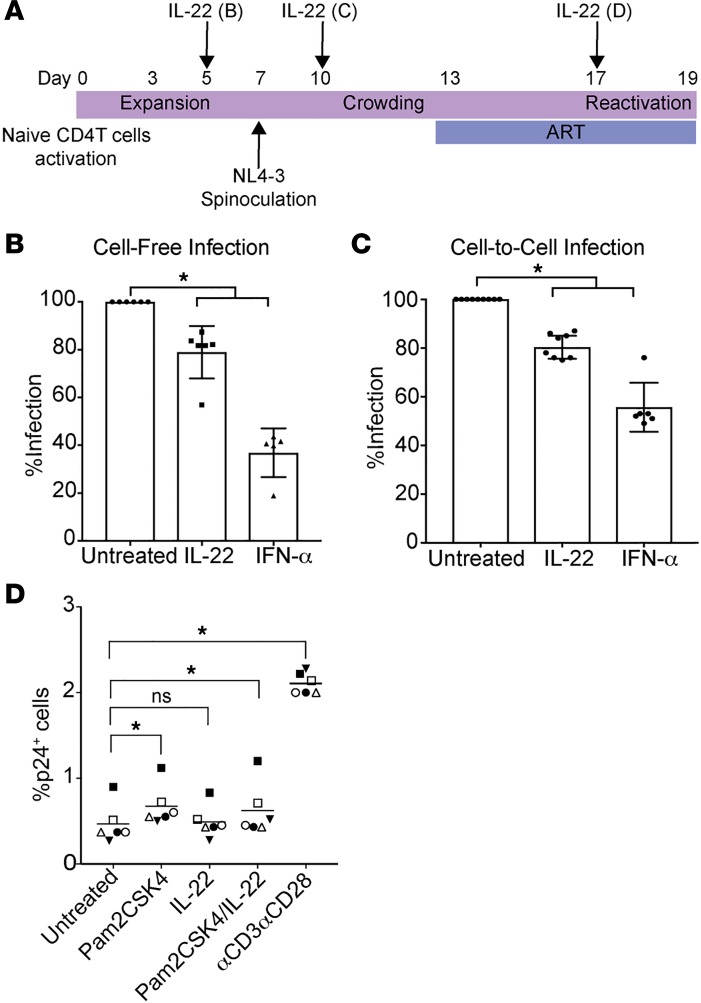
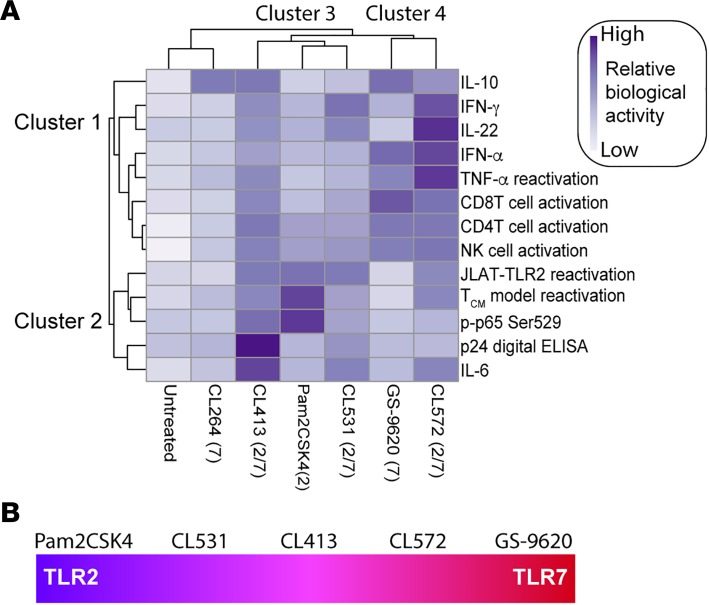
The presence of a reservoir of latently infected cells in HIV-infected patients is a major barrier towards finding a cure. One active cure strategy is to find latency-reversing agents that induce viral reactivation, thus leading to immune cell recognition and elimination of latently infected cells, known as the shock-and-kill strategy. Therefore, the identification of molecules that reactivate latent HIV and increase immune activation has the potential to further these strategies into the clinic. Here, we characterized synthetic molecules composed of a TLR2 and a TLR7 agonist (dual TLR2/7 agonists) as latency-reversing agents and compared their activity with that of the TLR2 agonist Pam2CSK4 and the TLR7 agonist GS-9620. We found that these dual TLR2/7 agonists reactivate latency by 2 complementary mechanisms. The TLR2 component reactivates HIV by inducing NF-κB activation in memory CD4+ T cells, while the TLR7 component induces the secretion of TNF-α by monocytes and plasmacytoid dendritic cells, promoting viral reactivation in CD4+ T cells. Furthermore, the TLR2 component induces the secretion of IL-22, which promotes an antiviral state and blocks HIV infection in CD4+ T cells. Our study provides insight into the use of these agonists as a multipronged approach targeting eradication of latent HIV.

Keywords: AIDS/HIV; Immunology; Innate immunity; NF-kappaB; T cells.


Conflict of interest statement

Conflict of interest: The authors have declared that no conflict of interest exists.

Figures

Figure 1
Figure 1. Dual TLR2/7 agonists induce HIV reactivation in latently infected CD4+ T cells.
(A) Viral reactivation mediated by TLR agonists in JLAT10.6 and JLAT-TLR2. Data represent the mean ± SD of a representative experiment from 3 independent experiments performed in triplicate. (B) Dose-response of Pam2CSK4, Pam3CSK4, CL401, CL413, CL531, and CL572 ranging from 0.1 pM to 1 μM in JLAT-TLR2. Data represent the mean ± SD of a representative experiment from 3 independent experiments preformed in triplicate. (C and D) Reactivation of latent HIV in the Tcm model with IL-2 alone (untreated), IL-2 plus 1 μM of the indicated TLR agonist or αCD3αCD28 (n = 5). (E) Expression of CD69 in total isolated CD4+ T cells treated with the indicated TLR agonist or αCD3αCD28 (n = 3). Data represent the mean ± SD. (F) Percentage of p65 phosphorylation on serine 529 in memory CD4+ T cells after 15 minutes of stimulation with the indicated TLR agonist or PMA (n = 8–10). Data represent the mean ± SD. (G) Spearman’s correlation of the levels of phosphorylated p65 with the normalized reactivation levels in the Tcm model. Data represent the mean ± SD. (H) Reactivation of latent HIV in the Tcm model induced by HODHBt at 100 μM alone or combined with 1 μM Pam2CSK4 or 1 μM CL413; values were normalized relative to αCD3αCD28 (n = 6). *P < 0.05, **P < 0.01 by 2-tailed Wilcoxon’s matched-pairs signed-rank test for all comparisons. ns, not significant.
Figure 2
Figure 2. The ability TLR7 agonists to reactivate HIV is mediated by TNF-α.
(A) Schematic of the assay. (B) Box-and-whisker plots indicating the percentage viral reactivation in JLAT10.6 cells incubated with supernatants collected from PBMCs stimulated with the TLR agonists indicated (n = 9–12). Error bars indicate maximum and minimum. (C) Box-and-whisker plots indicating viral reactivation mediated by supernatants from PBMCs treated with GS-9620 and CL413 preincubated with a monoclonal antibody against TNF-α or an isotype control (n = 6). Error bars indicate maximum and minimum. (D) Viral reactivation of latent HIV in the Tcm model with TNF-α, Pam2CSK4, or a combination of the two (n = 6). Data were normalized relative to the reactivation mediated by αCD3αCD28. (E) Calculation of synergy for LRA combination using the Bliss independence model. Data are presented as the difference between the observed and predicted fractional response. Statistical significance for the experimental fa was calculated using a ratio paired t test compared with the predicted fa for the combination (n = 6). (F) PBMCs treated with Pam2CSK4, GS-9620, and CL413 overnight were stained for cell-type specific markers and TNF-α (n = 6). Data represent the mean ± SD. (G) Pie chart visualization of the relative contribution of each cell type to the total TNF-α response for each stimulation (n = 6). *P < 0.05, ***P < 0.001 by 2-tailed Wilcoxon’s matched-pairs signed-rank test.
Figure 3
Figure 3. Dual TLR agonists induce NK cell activation without overt toxicity.
(A) Percentage of live cells after 48-hour incubation of PBMCs with 1 μM of the indicated TLR agonists or PMA plus ionomycin (PMA/ION). Gray circles represent aviremic participants and black squares HIV-negative donors. For simplicity the results were combined and a unique mean is depicted (n = 6 each group). (BD) CD69 induction of (B) NK cells, (C) CD4+ T cells, and (D) CD8+ T cells (n = 6 each group). Statistical analysis is provided in Supplemental Tables. Mann-Whitney U test was used for comparisons between HIV-negative donors and aviremic participants and 2-tailed Wilcoxon’s matched-pairs signed-rank test was used to compare stimuli.
Figure 4
Figure 4. Dual TLR agonists induce secretion of proinflammatory and antiviral cytokines.
Levels of IL-6 (A), IL-10 (B), IFN-γ (C), IL-22 (D), and IFN-α (E) were quantified in cell culture supernatants after treatment of PBMCs isolated from aviremic participants and HIV-negative donors with 1 μM of indicated TLR agonists or PMA plus ionomycin (PMA/ION) for 3 days. (F) p24 Gag protein was quantified in cell culture supernatants from PBMCs isolated from ART-suppressed HIV-infected individuals and treated with TLR agonists for 4 days using a digital ELISA (n = 8). Statistical analysis is provided in Supplemental Tables. Mann-Whitney U test was used for comparisons between HIV-negative donors and aviremic participants and 2-tailed Wilcoxon’s matched-pairs signed-rank test was used to compare stimuli. *P < 0.05.
Figure 5
Figure 5. IL-22 promotes an antiviral state in CD4+ T cells.
(A) Experimental assay timeline. (B) Cells were pretreated with IL-22 or IFN-α for 48 hours before spinoculation and the levels of infection were measured 3 days after (n = 6). Data represent the mean ± SD. (C) Cells were treated with IL-22 or IFN-α during the crowding phase (n = 6–10). Data represent the mean ± SD. (D) Reactivation of latent HIV in the Tcm model with IL-2 alone (untreated), IL-22, 1 μM Pam2CSK4, the combination of Pam2CSK4 and IL-22, or αCD3αCD28 (n = 6). *P < 0.05 by 2-tailed Wilcoxon’s matched-pairs signed-rank test. ns, not significant.
Figure 6
Figure 6. Heatmap visualization of the ability of each TLR agonist to have different biological activities.
(A) The clustergram at the left of the heatmap reflects the relationships between the different biological activities across compounds. The clustergram at the top of the heatmap reflects the relationship between each TLR agonist across the different biological activities. Clustergrams were created using ClustVis. Dark blue cells in the heatmap reflect biological activity, whereas light blue cells indicate that the compounds do not have biological activity. (B) CL413 is the dual TLR that exhibits the best TLR2 and TLR7 agonist activity.

Similar articles

Cited by

References

    1. Chun TW, et al. Quantification of latent tissue reservoirs and total body viral load in HIV-1 infection. Nature. 1997;387(6629):183–188. doi: 10.1038/387183a0. - DOI - PubMed
    1. Finzi D, et al. Identification of a reservoir for HIV-1 in patients on highly active antiretroviral therapy. Science. 1997;278(5341):1295–1300. doi: 10.1126/science.278.5341.1295. - DOI - PubMed
    1. Rathbun RC, Lockhart SM, Stephens JR. Current HIV treatment guidelines--an overview. Curr Pharm Des. 2006;12(9):1045–1063. doi: 10.2174/138161206776055840. - DOI - PubMed
    1. Wang Z, et al. Expanded cellular clones carrying replication-competent HIV-1 persist, wax, and wane. Proc Natl Acad Sci USA. 2018;115(11):E2575–E2584. doi: 10.1073/pnas.1720665115. - DOI - PMC - PubMed
    1. Finzi D, et al. Latent infection of CD4+ T cells provides a mechanism for lifelong persistence of HIV-1, even in patients on effective combination therapy. Nat Med. 1999;5(5):512–517. doi: 10.1038/8394. - DOI - PubMed

Publication types

MeSH terms