

Inhibition of Notch1 induces population and suppressive activity of regulatory T cell in inflammatory arthritis
- PMID: 30279738
- PMCID: PMC6160763
- DOI: 10.7150/thno.26093
Inhibition of Notch1 induces population and suppressive activity of regulatory T cell in inflammatory arthritis
Abstract
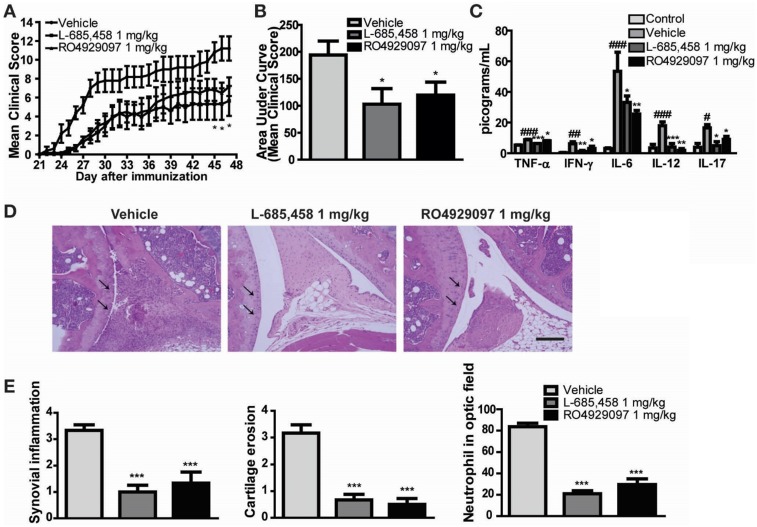
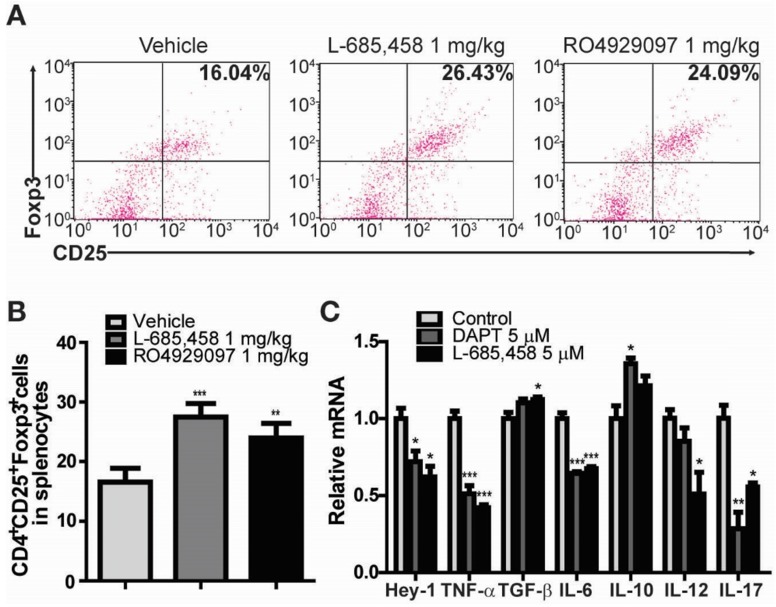
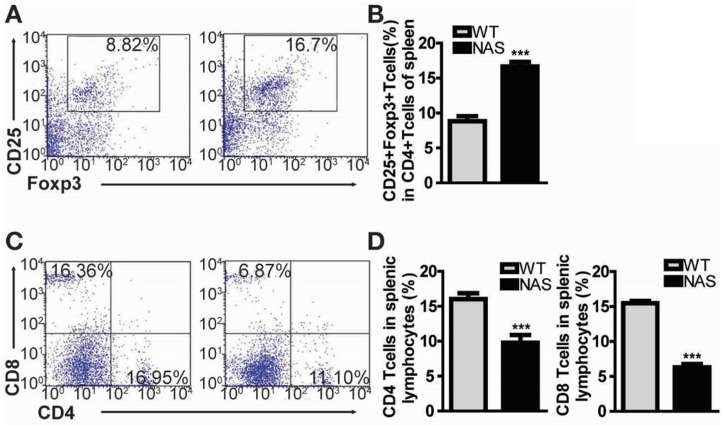
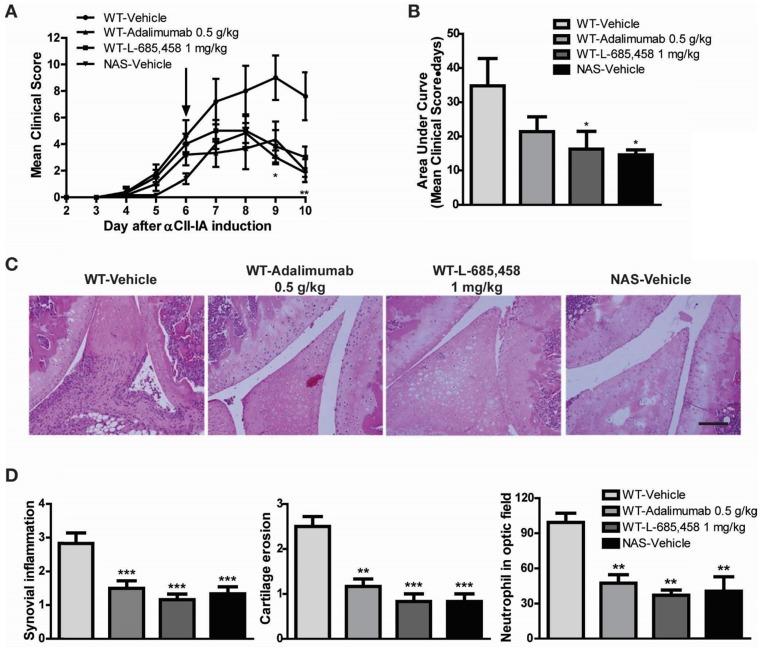
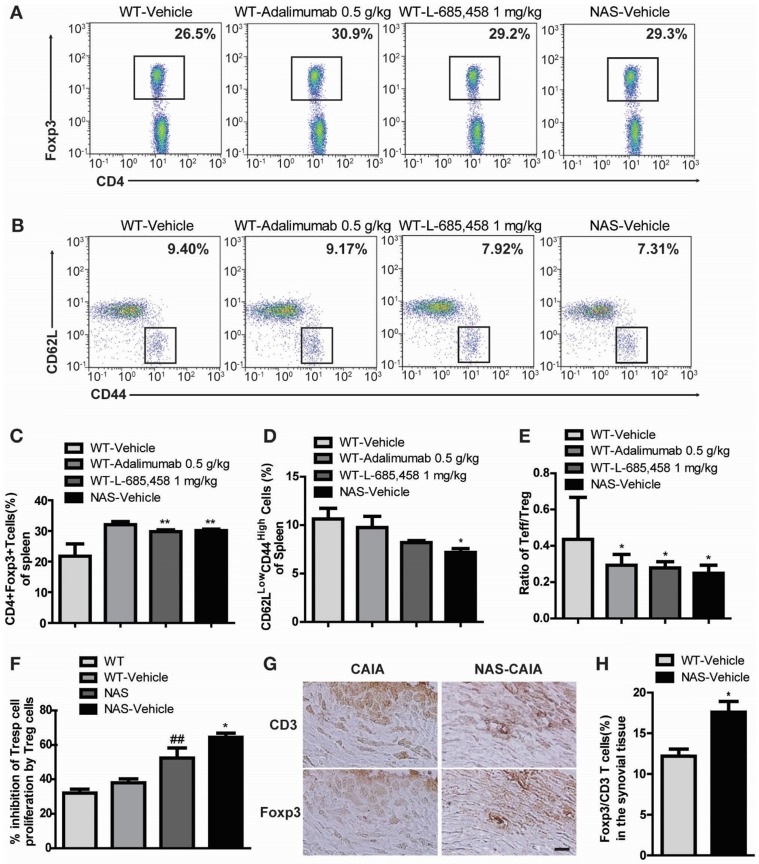
Inhibition of Notch signalling has shown anti-inflammatory properties in vivo and in vitro models of rheumatoid arthritis (RA). The objective of this study was to determine whether Notch1 might play a role in regulating T-regulatory cells (Tregs) in animal models of RA. Methods: Collagen-induced arthritis (CIA) and collagen antibody-induced arthritis (CAIA) were induced in C57BL/6, Notch1 antisense transgenic (NAS) or DBA1/J mice. We examined whether pharmacological inhibitors of γ-secretase (an enzyme required for Notch1 activation) and antisense-mediated knockdown of Notch1 could attenuate the severity of inflammatory arthritis in CIA and CAIA mice. Proportions of CD4+CD25+Foxp3+ Treg cells were measured by flow cytometry. To assess the suppressive capacity of Treg toward responder cells, CFSE-based suppression assay of Treg was performed. Results: γ-secretase inhibitors and antisense-mediated knockdown of Notch1 reduced the severity of inflammatory arthritis in both CIA and CAIA mice. Pharmacological and genetic inhibition of Notch1 signalling induced significant elevation of Treg cell population in CIA and CAIA mice. We also demonstrated that inhibition of Notch signalling suppressed the progression of inflammatory arthritis through modulating the expansion and suppressive function of regulatory T (Treg) cells. Conclusion: Pharmacological and genetic inhibition of Notch1 signalling suppresses the progression of inflammatory arthritis through modulating the population and suppressive function of Treg cells in animal models of RA.
Keywords: CAIA; CIA; Notch1; Treg; rheumatoid arthritis; γ-secretase.
Conflict of interest statement
Competing Interests: The authors have declared that no competing interest exists.
Figures
Similar articles
-
Therapeutic effect of a novel histone deacetylase 6 inhibitor, CKD-L, on collagen-induced arthritis in vivo and regulatory T cells in rheumatoid arthritis in vitro.Arthritis Res Ther. 2017 Jul 3;19(1):154. doi: 10.1186/s13075-017-1357-2. Arthritis Res Ther. 2017. PMID: 28673326 Free PMC article.
-
TGF-β-induced CD4+ FoxP3+ regulatory T cell-derived extracellular vesicles modulate Notch1 signaling through miR-449a and prevent collagen-induced arthritis in a murine model.Cell Mol Immunol. 2021 Nov;18(11):2516-2529. doi: 10.1038/s41423-021-00764-y. Epub 2021 Sep 23. Cell Mol Immunol. 2021. PMID: 34556822 Free PMC article.
-
Expression of tyrosine hydroxylase in CD4+ T cells contributes to alleviation of Th17/Treg imbalance in collagen-induced arthritis.Exp Biol Med (Maywood). 2016 Dec;241(18):2094-2103. doi: 10.1177/1535370216660635. Epub 2016 Jul 28. Exp Biol Med (Maywood). 2016. PMID: 27444150 Free PMC article.
-
Migration and homeostasis of regulatory T cells in rheumatoid arthritis.Front Immunol. 2022 Aug 9;13:947636. doi: 10.3389/fimmu.2022.947636. eCollection 2022. Front Immunol. 2022. PMID: 36016949 Free PMC article. Review.
-
Exploring the therapeutic potential of regulatory T cell in rheumatoid arthritis: Insights into subsets, markers, and signaling pathways.Biomed Pharmacother. 2024 May;174:116440. doi: 10.1016/j.biopha.2024.116440. Epub 2024 Mar 21. Biomed Pharmacother. 2024. PMID: 38518605 Review.
Cited by
-
The Role of Notch Signaling in Macrophages during Inflammation and Infection: Implication in Rheumatoid Arthritis?Cells. 2020 Jan 2;9(1):111. doi: 10.3390/cells9010111. Cells. 2020. PMID: 31906482 Free PMC article. Review.
-
Targeting the Notch Signaling Pathway in Chronic Inflammatory Diseases.Front Immunol. 2021 Apr 12;12:668207. doi: 10.3389/fimmu.2021.668207. eCollection 2021. Front Immunol. 2021. PMID: 33912195 Free PMC article. Review.
-
Large-scale computational modelling of the M1 and M2 synovial macrophages in rheumatoid arthritis.NPJ Syst Biol Appl. 2024 Jan 26;10(1):10. doi: 10.1038/s41540-024-00337-5. NPJ Syst Biol Appl. 2024. PMID: 38272919 Free PMC article.
-
Hepatocyte growth factor overexpression promotes osteoclastogenesis and exacerbates bone loss in CIA mice.J Orthop Translat. 2020 Dec 10;27:9-16. doi: 10.1016/j.jot.2020.10.011. eCollection 2021 Mar. J Orthop Translat. 2020. PMID: 33344167 Free PMC article.
-
The Notch signaling-regulated angiogenesis in rheumatoid arthritis: pathogenic mechanisms and therapeutic potentials.Front Immunol. 2023 Oct 26;14:1272133. doi: 10.3389/fimmu.2023.1272133. eCollection 2023. Front Immunol. 2023. PMID: 38022508 Free PMC article. Review.
References
-
- McInnes IB, Schett G. Cytokines in the pathogenesis of rheumatoid arthritis. Nat Rev Immunol. 2007;7:429–42. - PubMed
-
- Feldmann M, Brennan FM, Maini RN. Role of cytokines in rheumatoid arthritis. Annu Rev Immunol. 1996;14:397–440. - PubMed
-
- McInnes IB, Schett G. The pathogenesis of rheumatoid arthritis. N Engl J Med. 2011;365:2205–19. - PubMed
-
- Smolen JS, Aletaha D, McInnes IB. Rheumatoid arthritis. Lancet. 2016;388:2023–38. - PubMed
-
- Fiuza UM, Arias AM. Cell and molecular biology of Notch. J Endocrinol. 2007;194:459–74. - PubMed
MeSH terms
Substances
LinkOut - more resources
Full Text Sources
Medical
Molecular Biology Databases
Research Materials
