. 2018 Aug 24:1:123.
doi: 10.1038/s42003-018-0124-5. eCollection 2018.

SLO potassium channels antagonize premature decision making in C. elegans

Affiliations

SLO potassium channels antagonize premature decision making in C. elegans

Ichiro Aoki et al. Commun Biol. .

Abstract

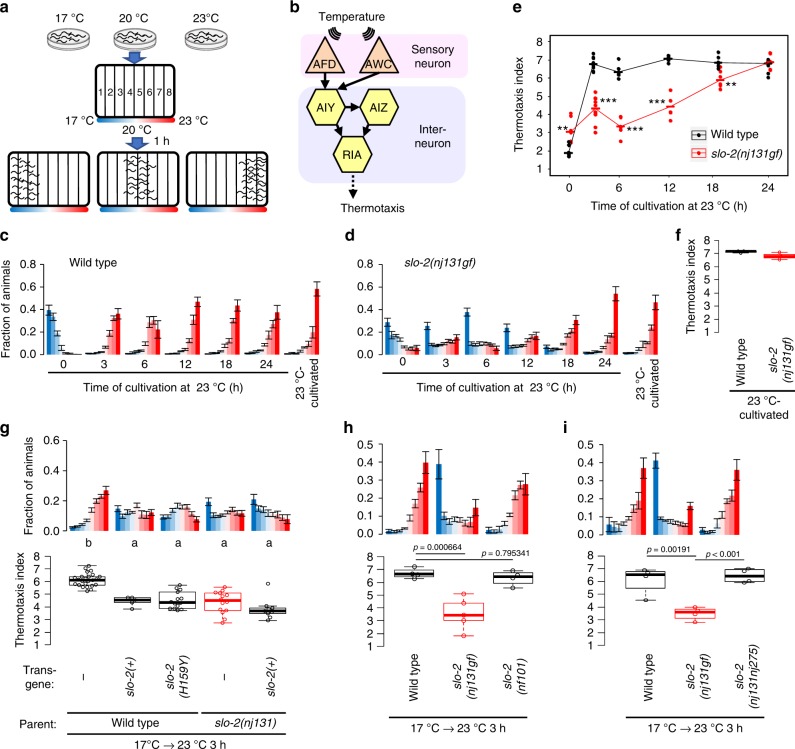
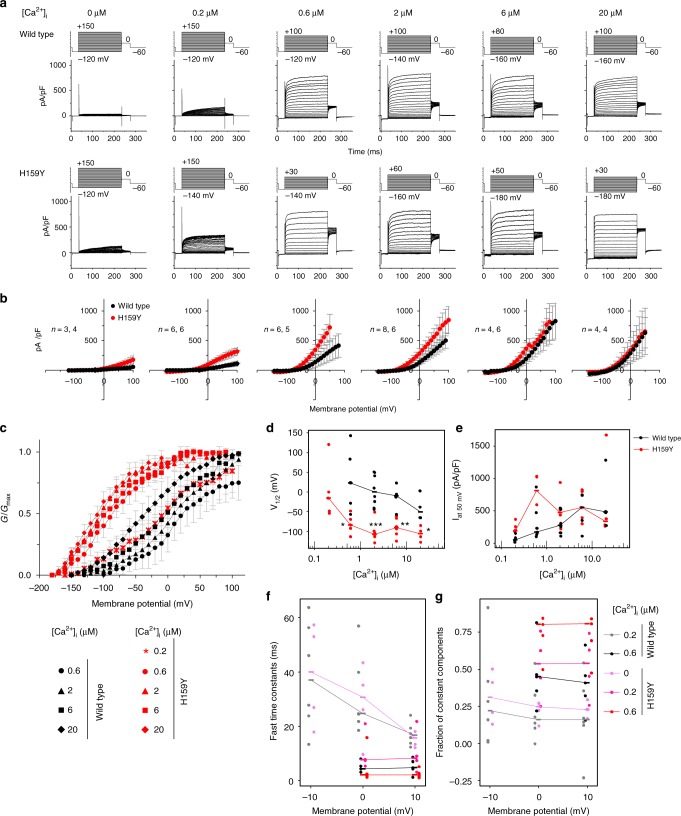
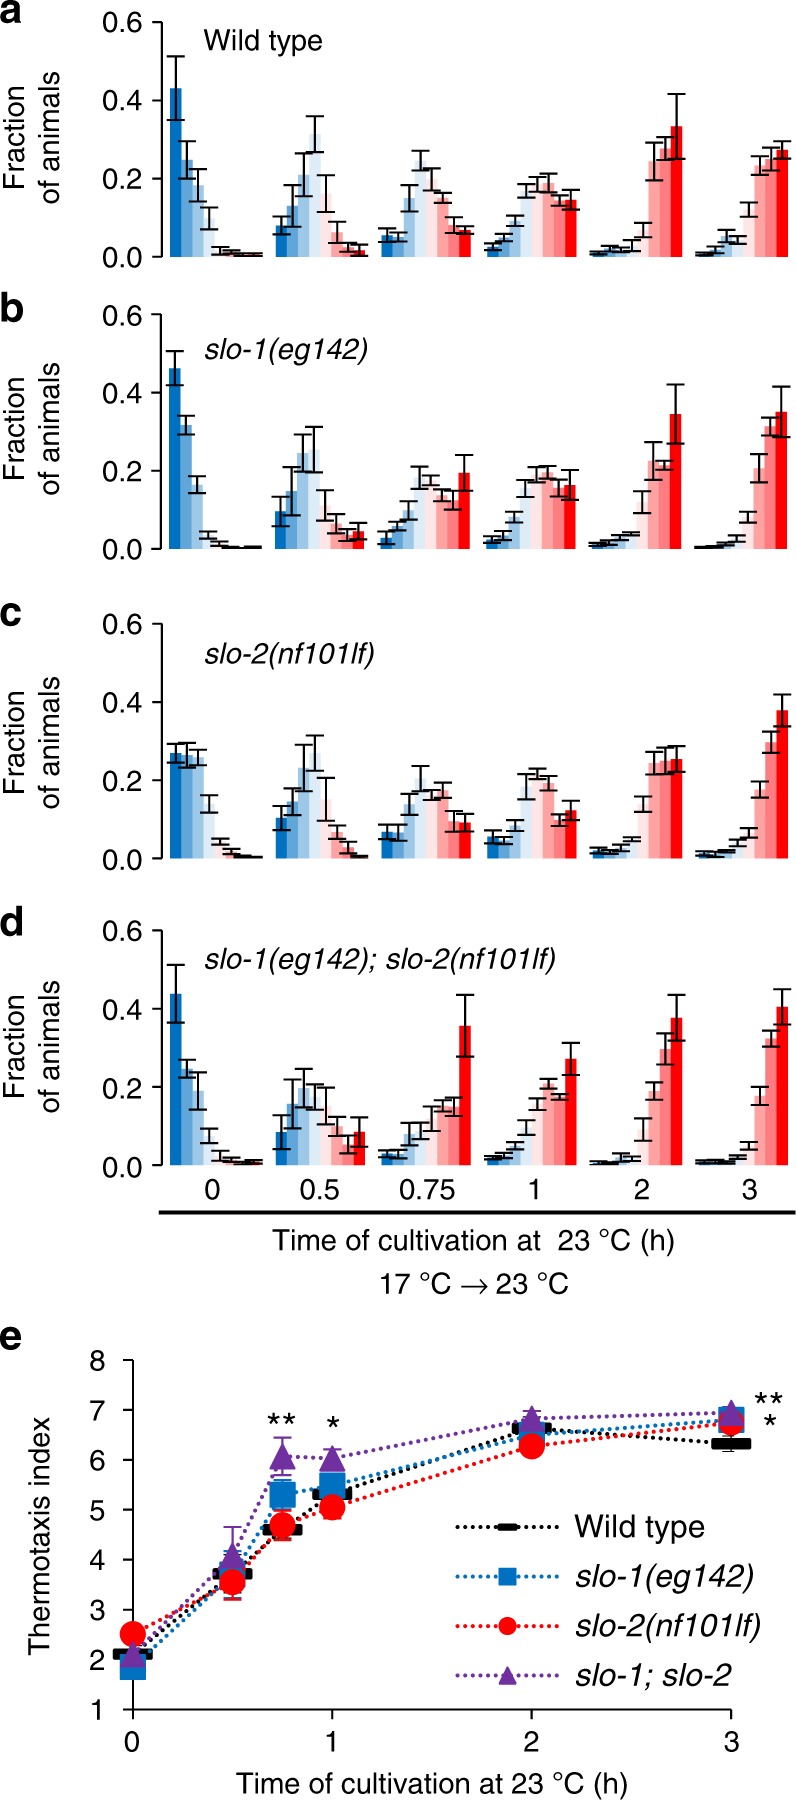
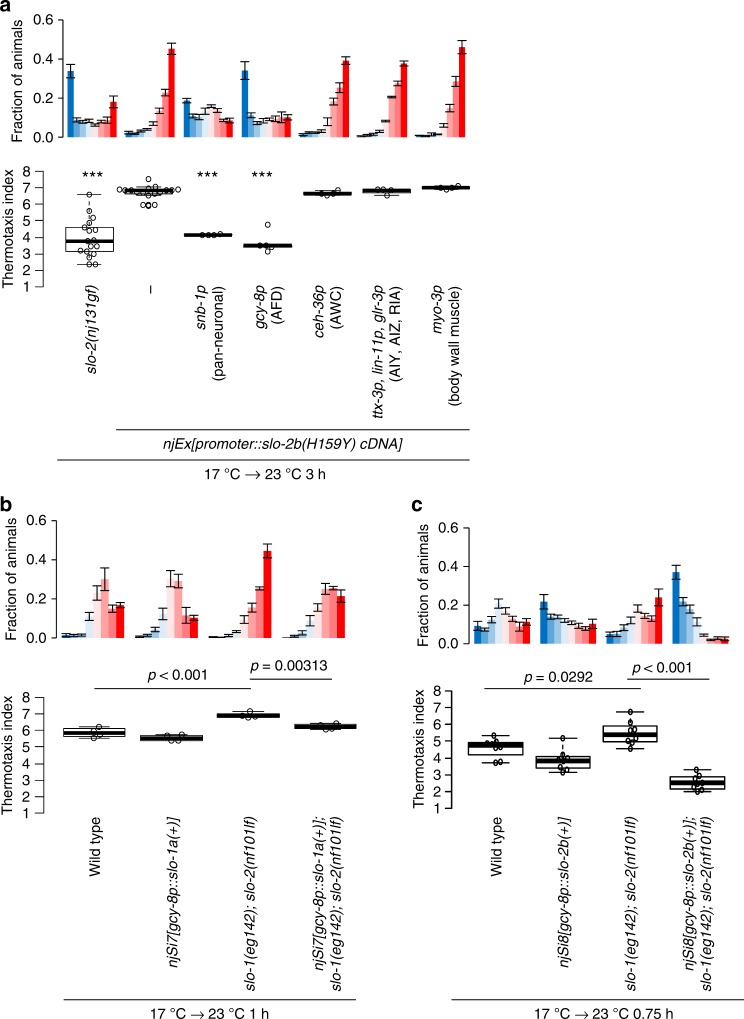
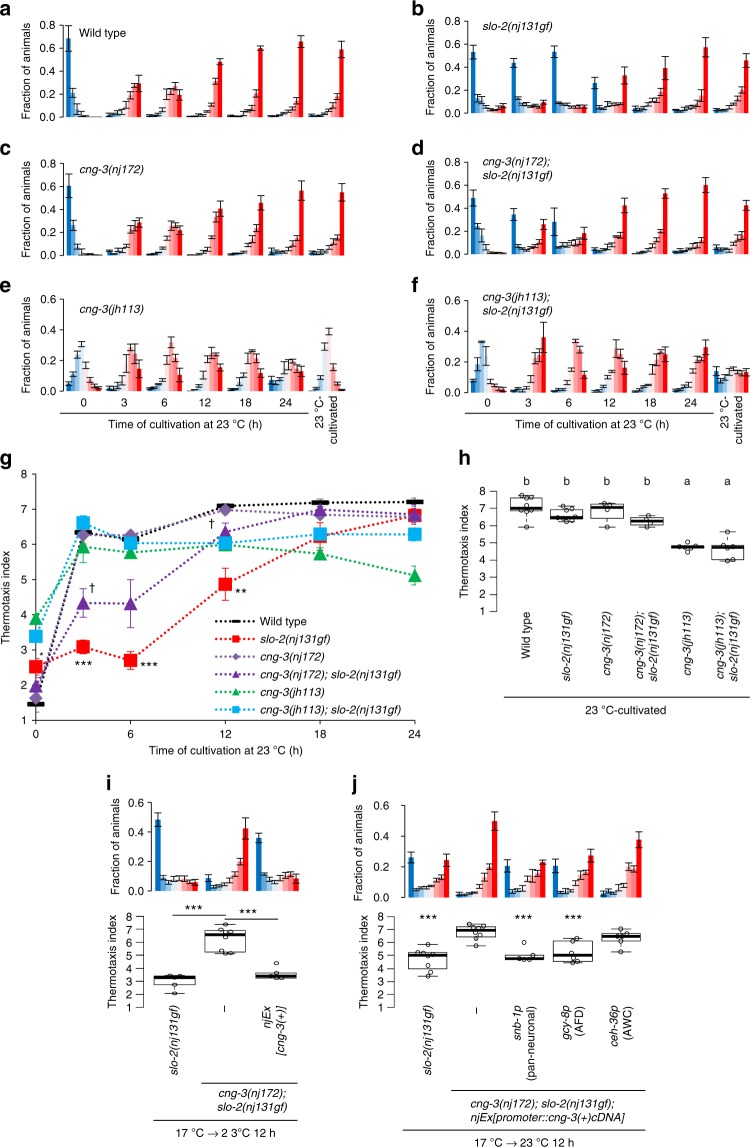
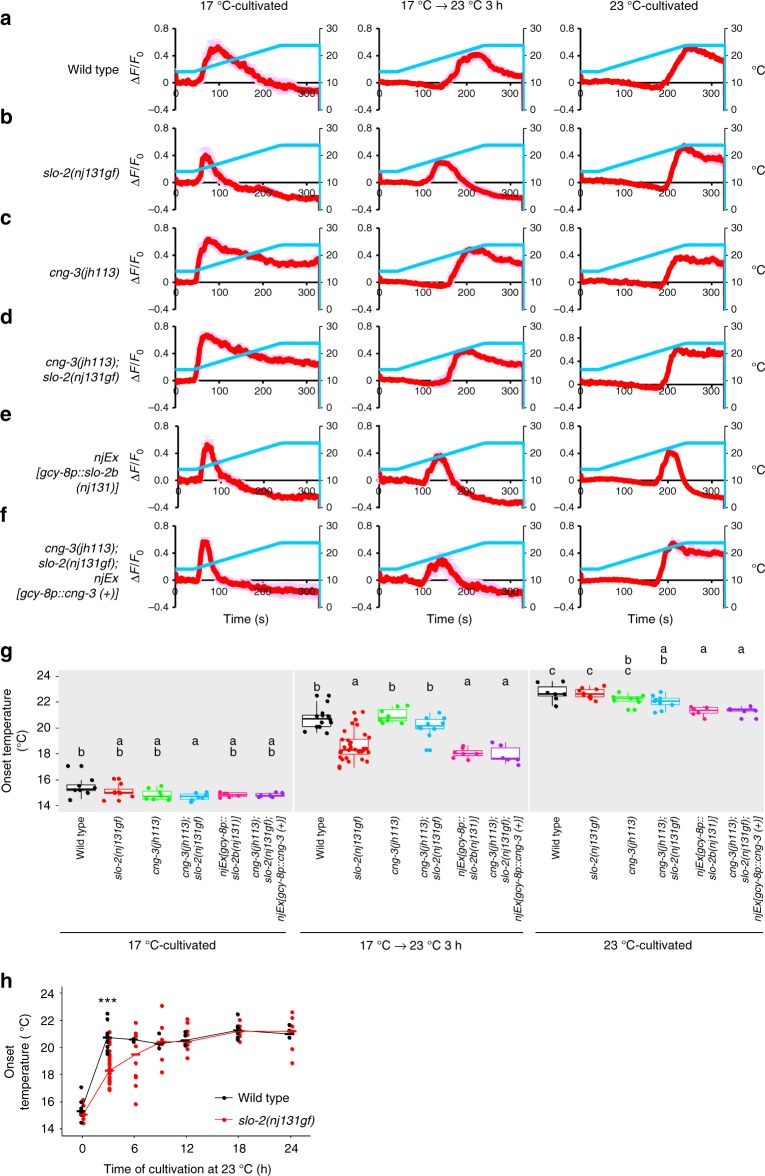
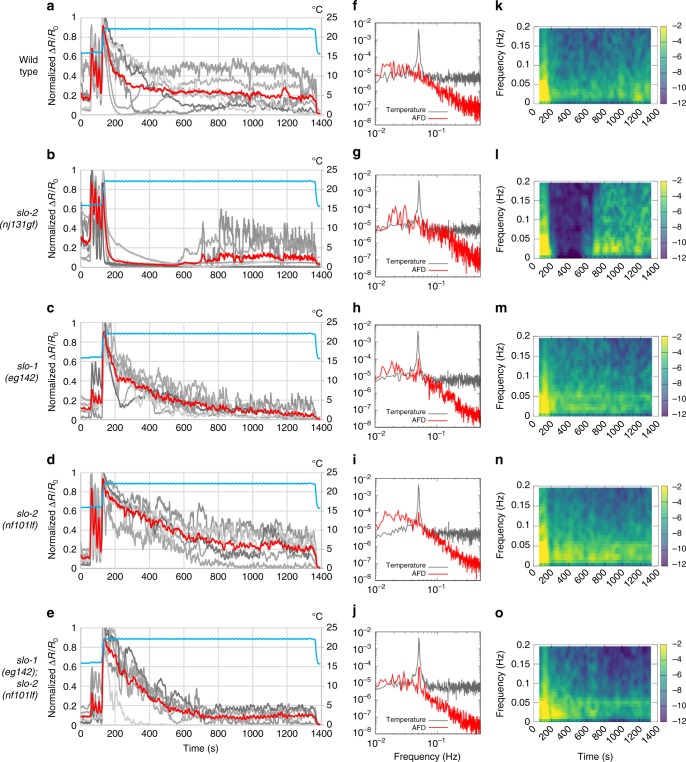
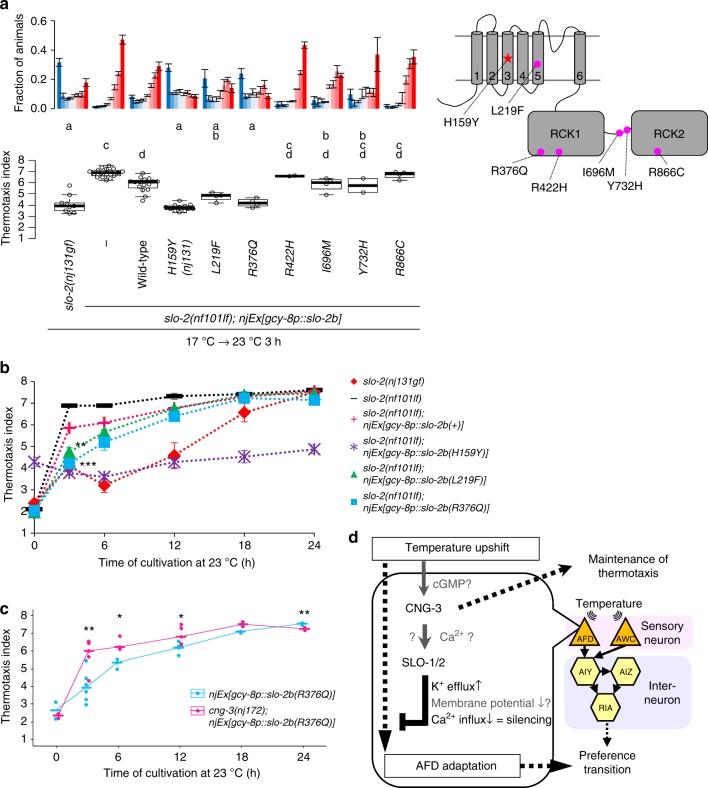
Animals must modify their behavior with appropriate timing to respond to environmental changes. Yet, the molecular and neural mechanisms regulating the timing of behavioral transition remain largely unknown. By performing forward genetics to reveal mechanisms that underlie the plasticity of thermotaxis behavior in C. elegans, we demonstrated that SLO potassium channels and a cyclic nucleotide-gated channel, CNG-3, determine the timing of transition of temperature preference after a shift in cultivation temperature. We further revealed that SLO and CNG-3 channels act in thermosensory neurons and decelerate alteration in the responsiveness of these neurons, which occurs prior to the preference transition after a temperature shift. Our results suggest that regulation of sensory adaptation is a major determinant of latency before animals make decisions to change their behavior.


Conflict of interest statement

The authors declare no competing interests.

Figures

Fig. 1
Fig. 1
Gain of SLO-2 function decelerates transition of preference in thermotaxis behavior. a A scheme for a thermotaxis assay is shown. C. elegans cultivated at a certain temperature is placed at the center of a linear thermal gradient without food and is allowed to freely migrate for 1 h. b A neural circuit regulating thermotaxis is shown. c, d Wild-type (c) and slo-2(nj131gf) (d) animals were cultivated at 17 °C for 5 days and then at 23 °C for the time indicated or constantly at 23 °C for 3 days. The animals were then placed on a thermal gradient. The number of animals in each section of the thermal gradient was determined, and the proportion of animals in each region was plotted on a histogram. n = 6, 10, 6, 6, 6, 6, 3 for each time point (c, d). The error bars represent the standard error of mean (SEM). e The thermotaxis indices at each time point (c, d) were plotted against time after the cultivation temperature was changed to 23 °C. Horizontal bars indicate medians. **p < 0.01, ***p < 0.001 (Welch two-sample t test). f The thermotaxis indices are shown for animals cultivated constantly at 23 °C in c, d. g Genomic PCR fragments covering slo-2 gene locus that were derived from either wild-type or nj131 mutant animals were injected into either wild-type or nj131 animals. Animals were cultivated at 17 °C for 5 days and at 23 °C for 3 h and then subjected to thermotaxis assay, as described above. Animals with extra chromosomal arrays were scored to evaluate thermotaxis. The fractions of animals were plotted on histograms (upper), and the thermotaxis indices were shown on boxplots (lower). n = 24, 5, 14, 14, 9 for each strain. The indices of strains marked with distinct alphabets differ significantly (p < 0.001) according to Tukey–Kramer test. h, i Wild-type and indicated slo-2 mutant animals were cultivated at 17 °C for 5 days and at 23 °C for 3 h and then subjected to thermotaxis assay. n = 4 or 5. p Values are indicated (Dunnett test against wild-type (h) or Tukey–Kramer test (i)). See also Supplementary Fig. 1
Fig. 2
Fig. 2
The channel currents of mutant SLO-2 (H159Y) are larger than those of wild type. a Representative whole-cell current recordings of HEK293T cells expressing either wild-type (n = 3, 6, 6, 8, 4, 4) or H159Y mutant (n = 4, 5, 5, 6, 6, 4) SLO-2 channels by patch clamp method are shown. Cells were held at −60 mV and depolarizing step pulses (200 ms) were applied as indicated above the current traces. Intracellular Ca2+ concentration ([Ca2+]i) is indicated above the current traces. b Current densities were measured at the end of step pulses and averaged for each membrane potential and [Ca2+]i and are plotted against membrane potential. Currents were recorded in distinct cells, and the numbers of replications for wild-type and H159Y channels are indicated. The error bars represent the SEM. c Conductance (G) was measured as the tail current amplitude at 0 mV after various step-pulse stimulations and was normalized to the recorded maximal amplitude at the most depolarized potential (Gmax). Normalized conductance (G/Gmax) is plotted against membrane potential. The meaning of the symbols is indicated in the figure. The error bars represent the SEM. d The voltage at half-maximal activation(V1/2) of wild-type and H159Y mutant channels calculated from c is plotted against [Ca2+]i. Horizontal bars represent medians. *p < 0.05, **p < 0.01, ***p < 0.001 (Welch two-sample t test). e Current density at depolarization of a 50 mV pulse was measured and averaged for each [Ca2+]i and then plotted against [Ca2+]i. Horizontal bars represent medians. f The activation time constants were obtained by fitting the outward current traces to double exponential functions. The fast time constants are plotted against membrane potential. Horizontal bars represent medians. g The fraction of instantaneously opening channels was calculated as the fraction of constant components of the fitting curves and is plotted against the membrane potential. Horizontal bars represent medians
Fig. 3
Fig. 3
slo-1; slo-2 double loss-of-function mutants are fast to change their behavior. ad Wild-type (a), slo-1(eg142) (b), slo-2(nf101) (c), and slo-1(eg142); slo-2(nf101) (d) animals were cultivated at 17 °C for 5 days and then at 23 °C for the time indicated. The animals were then subjected to thermotaxis assay. The fractions of animals are plotted on histograms. The error bars represent the SEM. n = 4, 4, 6, 10, 4, 5 for wild-type animals and n = 6, 4, 6, 10, 4, 8 for others. e The means of the thermotaxis indices are plotted against time after the cultivation temperature was changed to 23 °C. The error bars represent the SEM. *p < 0.05, **p < 0.01 (Dunnett test against wild-type animals). Individual data points are shown in Supplementary Fig. 3a. See also Supplementary Figs 1, 2, and 3
Fig. 4
Fig. 4
SLO K+ channels act in the AFD thermosensory neuron to decelerate preference transition in thermotaxis. a Animals expressing the H159Y mutant form of SLO-2 isoform b under the control of promoters indicated were cultivated at 17 °C for 5 days and then at 23 °C for 3 h and subjected to thermotaxis assay. The fractions of animals and thermotaxis indices are plotted. n = 17, 17, 4, 5, 4, 4, 4. ***p < 0.001 (Dunnett test against wild type). b Wild-type animals, wild-type animals that express SLO-1 in AFD after insertion of a single copy of a transgene into a genome, slo-1(eg142); slo-2(nf101) animals, and slo-1(eg142); slo-2(nf101) animals that express SLO-1 in AFD after insertion of a single copy of a transgene were cultivated at 17 °C for 5 days and then at 23 °C for 1 h. Animals were then subjected to thermotaxis assay. n = 4. p Values are indicated (Tukey-Kramer test). c Wild-type animals, wild-type animals that express SLO-2 in AFD after insertion of a single copy of a transgene into a genome, slo-1(eg142); slo-2(nf101) animals, and slo-1(eg142); slo-2(nf101) animals that express SLO-2 in AFD after insertion of a single copy of a transgene were cultivated at 17 °C for 5 days and then at 23 °C for 45 min. Animals were then subjected to thermotaxis assay. n = 8. p Values are indicated (Tukey-Kramer test). See also Supplementary Fig. 4
Fig. 5
Fig. 5
cng-3 loss-of-function suppresses decelerated preference transition in slo-2(nj131gf) mutants. af Wild-type (a, n = 3, 3, 5, 3, 3, 6, 8), slo-2(nj131gf) (b, n = 3, 9, 5, 5, 3, 3, 8), cng-3(nj172) (c, n = 3, 3, 3, 3, 3, 5, 4), cng-3(nj172); slo-2(nj131gf) (d, n = 3, 9, 5, 5, 3, 3, 4), cng-3(jh113) (e, n = 5, 3, 3, 3, 3, 5, 6), and cng-3(jh113); slo-2(nj131gf) (f, n = 3, 3, 3, 3, 3, 5, 6) animals were cultivated at 17 °C for 5 days and then at 23 °C for the time indicated or constantly at 23 °C for 3 days. Animals were then subjected to thermotaxis assay. The fractions of animals are plotted. g The means of the thermotaxis indices at each time point (af) are plotted against time after cultivation temperature was changed to 23 °C. The error bars represent the SEM. *p < 0.05, **p < 0.01, ***p < 0.001 between wild-type and slo-2(nj131gf) animals, and p < 0.05 between slo-2(nj131gf) and cng-3(nj172); slo-2(nj131gf) animals (Tukey–Kramer test). h The thermotaxis indices for animals cultivated constantly at 23 °C in af are shown. The indices of strains marked with distinct alphabets differ significantly (p < 0.001) according to Tukey–Kramer test. i Genomic PCR fragments covering the cng-3 locus were injected into cng-3(nj172); slo-2(nj131gf) animals. Animals were cultivated first at 17 °C, then at 23 °C for the time indicated, and then subjected to thermotaxis assay. n = 5, 8, 5. ***p < 0.001 (Tukey–Kramer test). j cng-3(nj172); slo-2(nj131gf) animals expressing cng-3 under control of the indicated promoters were cultivated at 17 °C for 5 days, then at 23 °C for 12 h, and then subjected to thermotaxis assay. n = 8, 8, 6, 6, 5. ***p < 0.001 (Dunnett test against cng-3(nj172); slo-2(nj131gf) animals). See also Supplementary Figs. 5 and 6
Fig. 6
Fig. 6
SLO K+ channels slow down AFD adaptation. af Wild-type (a, n = 8, 13, 7), slo-2(nj131gf) (b, n = 8, 31, 10), cng-3(jh113) (c, n = 8, 8, 8), and cng-3(jh113); slo-2(nj131gf) (d, n = 7, 10, 9) animals; animals expressing SLO-2b(H159Y) in AFD (e, n = 6, 7, 6); and cng-3(jh113); slo-2(nj131gf) animals expressing CNG-3 in AFD (f, n = 6, 6, 6) that expressed R-CaMP2 in AFD were cultivated at 17 °C for 5 days, at 17 °C for 5 days and then at 23 °C for 3 h or at 23 °C for 3 days. Animals were then subjected to Ca2+ imaging analysis. The animals were initially kept at 14 °C for 40 s and then subjected to a linear temperature rise to 24 °C over 200 s followed by 90 s of incubation at 24 °C. Temperature stimuli and changes in fluorescence intensity are indicated with blue and red lines, respectively. Data were collected from distinct animals. Pale red shadow represents the SEM. g The onset temperatures at which the AFD response reached half of the maximum during the above experiment (af) are plotted. The onset temperatures of strains marked with distinct alphabets differ significantly (p < 0.05) according to Tukey–Kramer test under the same cultivation conditions. h Wild-type and slo-2(nj131gf) animals that express R-CaMP2 in AFD were cultivated at 17 °C for 5 days and then at 23 °C for the time indicated. Animals were then subjected to Ca2+ imaging with the same temperature increase stimulus as in af. Onset temperature is plotted, and medians are indicated with horizontal bars. Data at 0 and 3 h are identical to those in a, b. n = 3, 3, 4, 6, 4 for wild-type and n = 10, 8, 9, 8, 7 for slo-2(nj131gf) animals at each time point (6, 9, 12, 18, and 24 h). ***p < 0.001 (Welch two-sample t test between wild-type and slo-2(nj131gf) animals)
Fig. 7
Fig. 7
Endogenous SLO K+ channels slow down AFD adaptation. ae Wild-type (a), slo-2(nj131gf) (b), slo-1(eg142) (c), slo-2(nf101) (d), and slo-1(eg142); slo-2(nf101) (e) animals that express GCaMP3 and tagRFP in AFD were cultivated at 17 °C for 5 days and subjected to Ca2+ imaging analysis with a temperature stimulus involving 20 s (0.05 Hz) oscillations around 17 °C followed by a temperature upshift to 23 °C and oscillations around 23 °C. The intensity of green fluorescence was divided by that of red fluorescence, and the ratio was normalized to a range between 0 and 1 and plotted against time. Gray and red lines indicate traces from individual animals and the average, respectively. Data were collected from distinct animals (n = 6). fj The Fourier transform was computed with the Hanning window on the temperature program and ratio of fluorescence intensity between 401 and 1390 s for each animal in ae. Averaged power spectra are plotted against frequency. ko Time evolutions of averaged spectrograms are plotted in a color map against the centric time of each segment. Trends detected by Butterworth filter were removed from the ratio of fluorescence intensity of each animal in ae. The resulting signals were divided into segments of 128 s, and the Fourier transform was separately computed for each segment
Fig. 8
Fig. 8
Epilepsy-related mutations potentiate SLO-2. a slo-2(nf101) animals expressing either wild-type or the indicated mutant form of SLO-2b in AFD were cultivated at 17 °C for 5 days and then at 23 °C for 3 h and then subjected to thermotaxis assay. Fractions of animals are plotted (upper). n = 9, 17, 16, 12, 4, 4, 2, 4, 2, 4. Thermotaxis indices of strains marked with distinct alphabets differ significantly (p < 0.05) according to Tukey–Kramer test (lower). b slo-2(nf101) animals expressing either wild-type or the indicated mutant form of SLO-2b in AFD were cultivated at 17 °C for 5 days and then at 23 °C for the indicated time points. The animals were then subjected to thermotaxis assay. The means of thermotaxis indices are shown. The error bars represent the SEM. Data at 3 h are identical to those in a. **p < 0.01, ***p < 0.001 (Tukey–Kramer test, compared with animals expressing SLO-2b(+)). The fractions of animals and individual indices at each time point are shown in Supplementary Fig. 7. c Animals expressing SLO-2b(R376Q) in AFD with either a wild-type or cng-3(nj172) background were cultivated at 17 °C for 5 days, then at 23 °C for the indicated time points, and then subjected to thermotaxis assay. Thermotaxis indices at each time point are shown. The horizontal bars represent the medians. n = 2, 6, 3, 5, 3, 3 for each time point. *p < 0.05, **p < 0.01 (Welch two-sample t test between two strains at each time point). The fractions of animals are shown in Supplementary Fig. 7. d A model for regulation of the timing of preference transition in thermotaxis is shown. SLO K+ channels and CNG-3 generate latency for preference transition in thermotaxis after an upshift in cultivation temperature by acting in AFD to slow down the AFD adaptation to new temperature. See also Supplementary Figs. 2, 3, 7, and 8

Similar articles

Cited by

References

    1. Doya K. Modulators of decision making. Nat. Neurosci. 2008;11:410–416. doi: 10.1038/nn2077. - DOI - PubMed
    1. Wang, X.-J. in Neuroeconomics 2nd edn (eds Glimcher, P. W. & Fehr, E.) Ch. 23 (Elsevier, 2014).
    1. Williams CT, Barnes BM, Kenagy GJ, Buck CL. Phenology of hibernation and reproduction in ground squirrels: integration of environmental cues with endogenous programming. J. Zool. 2014;292:112–124. doi: 10.1111/jzo.12103. - DOI
    1. Mori I, Ohshima Y. Neural regulation of thermotaxis in Caenorhabditis elegans. Nature. 1995;376:344–348. doi: 10.1038/376344a0. - DOI - PubMed
    1. Hedgecock EM, Russell RL. Normal and mutant thermotaxis in the nematode Caenorhabditis elegans. Proc. Natl. Acad. Sci. USA. 1975;72:4061–4065. doi: 10.1073/pnas.72.10.4061. - DOI - PMC - PubMed