. 2018 Jul 2:1:86.
doi: 10.1038/s42003-018-0090-y. eCollection 2018.

Phase transitions as intermediate steps in the formation of molecularly engineered protein fibers

Affiliations

Phase transitions as intermediate steps in the formation of molecularly engineered protein fibers

Pezhman Mohammadi et al. Commun Biol. .

Abstract

A central concept in molecular bioscience is how structure formation at different length scales is achieved. Here we use spider silk protein as a model to design new recombinant proteins that assemble into fibers. We made proteins with a three-block architecture with folded globular domains at each terminus of a truncated repetitive silk sequence. Aqueous solutions of these engineered proteins undergo liquid-liquid phase separation as an essential pre-assembly step before fibers can form by drawing in air. We show that two different forms of phase separation occur depending on solution conditions, but only one form leads to fiber assembly. Structural variants with one-block or two-block architectures do not lead to fibers. Fibers show strong adhesion to surfaces and self-fusing properties when placed into contact with each other. Our results show a link between protein architecture and phase separation behavior suggesting a general approach for understanding protein assembly from dilute solutions into functional structures.


Conflict of interest statement

The authors declare no competing interests.

Figures

Fig. 1
Fig. 1
Structure and liquid–liquid phase separation of 3-block proteins. a Schematic representation of the proteins used in this study (MW, molecular weight). b Centrifugation of the liquid–liquid phase separated protein in pure water with a dilute clear protein solution on top and a dense translucent protein phase on the bottom. c Inverted light microscopy and cryo-transmission electron microscopy images of the dense phase showing spherical liquid-like coacervates (LLC) with diameters of 1–15 µm (scale bars are 20 µm for the light microscopy images and 1 µm for the cryo-EM image). d Light microscopy images showing the development of LLCs for CBM-ADF3-CBM. As the overall concentration of the solution increased to 0.8% w/v, small LLCs emerged in the dense phase and as the overall concentration of the solution increased further to 1.8% w/v LLCs grew larger in size. Dilution led to a dissociation of the LLCs (scale bars are 20 µm). e Bright-field light microscopy images showing time frames of the fusion of two individual droplets (scale bar is 1 µm). f Deformation of a single LLC droplet under shear flow and the formation of a fluid thread. The black arrow shows the direction of the flow. The yellow arrow shows the point at which the fluid thread breaks and a satellite droplet emerges (scale bar is 10 µm). g Time frames from inverted light microscopy showing adhesion and assembly of LLCs on the surface of a glass slide (scale bar is 2 µm)
Fig. 2
Fig. 2
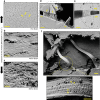
Phosphate-free and phosphate-containing conditions lead to different forms of coacervates. a Phosphate-free conditions lead to liquid-like coacervates (LLC) that show a reversible concentration-dependent formation (the three test tubes on the left). The tube most to the left is tilted to show that the dense phase is in a liquid form, while a potassium phosphate containing solution results in solid-like coacervates (SLC) that did not show dissociation during dilution (the two test tubes on the right). b Scanning electron micrograph of liquid ethane-propane vitrified and fractured specimens is LLC and c is the phosphate-induced SLC (scale bars 10 µm). In order to remove potassium phosphate, the SLC was washed three times with water before lyophilizing. d, e Images show differences in the internal structure of individual LLC and SLC droplets. The LLC was freeze-fractured while a focused ion beam was used to split the SLC (scale bars are 2 µm and 1 µm for the magnified inserts). f A high-magnification SEM image of the internal structure of a LLC droplet shows details of an internal bicontinuous network (scale bar 200 nm). g Electron tomography of SLC shows a porous bicontinuous structure (scale bar 30 nm). h FRAP experiments for a LLC coacervate. The inserts show droplets before and after bleaching at different time points (scale bars 2 µm). Additional data on SLC are shown in Supplementary Fig. 6
Fig. 3
Fig. 3
Cracks in semi-dry LLC droplets led to the formation of bridging filaments. a A thin film casted from a LLC containing solution with an overall protein concentration of 30% w/v (yellow arrows indicate individual LLC droplets in the unstrained film). Upon straining the semi-dried film to 100% (b) and 200% (c), long filaments appeared in cracks in the film in the direction of stretching (scale bar is 20 μm). d, e High-magnification SEM images from two individual micrometer sized LLCs (CBM-eADF3-CBM) embedded in a continuous matrix of non-coacervated protein. Upon pulling, bundles of nanometer size filaments bridging the cracks formed orthogonally to the direction of the crack (scale bar is 200 nm). As an aid to interpretation, the edges of the LLC droplet are marked with a dashed line and yellow arrows show the direction of crack propagation. f SEM micrograph of large LLCs with considerable plastic deformation pulled into a single and continuous filament (scale bar is 2 μm). At high magnification, nanometer size stripes became apparent both along and across the axis of the filaments (scale bar is 200 nm). Yellow arrows indicate striping patterns
Fig. 4
Fig. 4
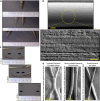
Dry spinning of 3-block architecture proteins into fibers at ambient temperature, pressure, and using water as the solvent. a Rapid formation of fibers by extending a 10–15 µL aliquot of LLC at 70–75% w/v. b SEM image of a single pulled fiber (scale bar 2 μm). High-magnification image from the surface of the fibers show a regular surface pattern with a periodicity of 20 nm (scale bar 200 nm). c Adherence of two freshly pulled fibers to each other. Junctions were strong enough to withstand stretching. d Electron micrographs showing the full fusion of two individual fibers placed in contact with each other. The fusing of fibers was dependent on water content, with dry fibers not fusing. The two original fibers are marked 1 and 2 (scale bar 20 μm)
Fig. 5
Fig. 5
Adhesive properties of LLC fibers and mechanical testing of single fibers. a The attachment of a freshly drawn CBM-eADF3-CBM fiber to a cellulose fiber (CNF) (scale bar 50 μm) showing b how the fluid nature of the fiber leads to a melting in of the structures (scale bar 200 nm). Yellow arrows indicate the interface. c Stapling of a cellulose fiber using multiple LLC fibers. The insert shows how LLC fibers fuse together (scale bar 100 μm and 20 μm). d The stapling led to the attachment of the cellulose fiber to a PMMA surface that resisted pulling (scale bar 200 μm). The yellow arrow marks a spot on the fiber for the determining the displacement. e The in-plane adhesion force measured in a tensiometer, showed rupture of individual fibers before the final break-off. f Tensile testing of individual fibers showed a two-stage mechanism with an initial elastic deformation that was followed by a plastic deformation until final rupture. g Cyclic measurements were used to confirm the elastic/plastic regions of the tensiogram, with a yield point at 1% strain
Fig. 6
Fig. 6
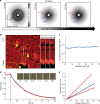
2D wide angle X-ray diffraction of the air pulled fibers and viscosity–surface tension estimation of LLC droplets. a 2D WAXS patterns for a bundle of LLC pulled fibers at 0, 100, and 150% strains. b Magnetophoretic movement of an encapsulated superparamagnetic (Fe3O4@PS) particle in LLC of CBM-eADF3-CBM (scale bar 50 μm). Box with the dashed line indicates the region of interest. The white dots denote the particle trajectory. The yellow arrow denotes the direction of the movement. c Viscosity as a function of the magnetic force. d Merging of two protein droplets and exponential decay fit of a merging event. e Relaxation time vs. final droplet radius for merging of LLCs of CBM-eADF3-CBM. The blue line is a linear fit of the data and the red lines represent boundaries of the inverse capillary velocity, η/γ ≈0.033 s μm−1

Similar articles

Cited by

References

    1. Shin Y, Brangwynne CP. Liquid phase condensation in cell physiology and disease. Science. 2017;357:eaaf4382. doi: 10.1126/science.aaf4382. - DOI - PubMed
    1. Hyman AA, Simons K. Phase transitions in cells. Science. 2012;337:1047–1049. doi: 10.1126/science.1223728. - DOI - PubMed
    1. Franzmann TM, et al. Phase separation of a yeast prion protein promotes cellular fitness. Science. 2018;359:eaao5654. doi: 10.1126/science.aao5654. - DOI - PubMed
    1. Yeo GC, Keeley FW, Weiss AS. Coacervation of tropoelastin. Adv. Colloid Interface Sci. 2011;167:94–103. doi: 10.1016/j.cis.2010.10.003. - DOI - PubMed
    1. Banani SF, Lee HO, Hyman AA, Rosen MK. Biomolecular condensates: organizers of cellular biochemistry. Nat. Rev. Mol. Cell Biol. 2017;18:285. doi: 10.1038/nrm.2017.7. - DOI - PMC - PubMed