. 2018 Sep 13:9:2074.
doi: 10.3389/fimmu.2018.02074. eCollection 2018.

Epigenetic Enhancer Marks and Transcription Factor Binding Influence Vκ Gene Rearrangement in Pre-B Cells and Pro-B Cells

Affiliations

Epigenetic Enhancer Marks and Transcription Factor Binding Influence Vκ Gene Rearrangement in Pre-B Cells and Pro-B Cells

Eden Kleiman et al. Front Immunol. .

Abstract

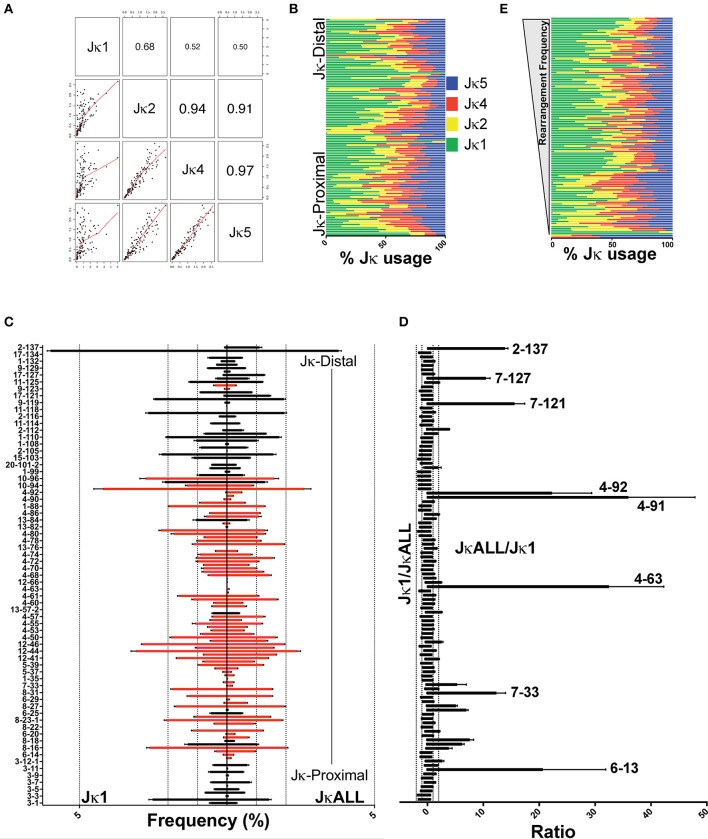
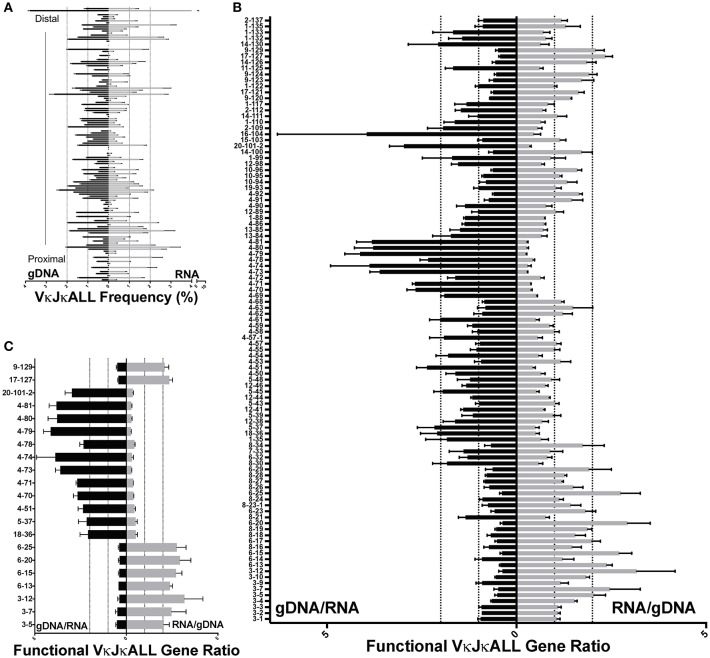
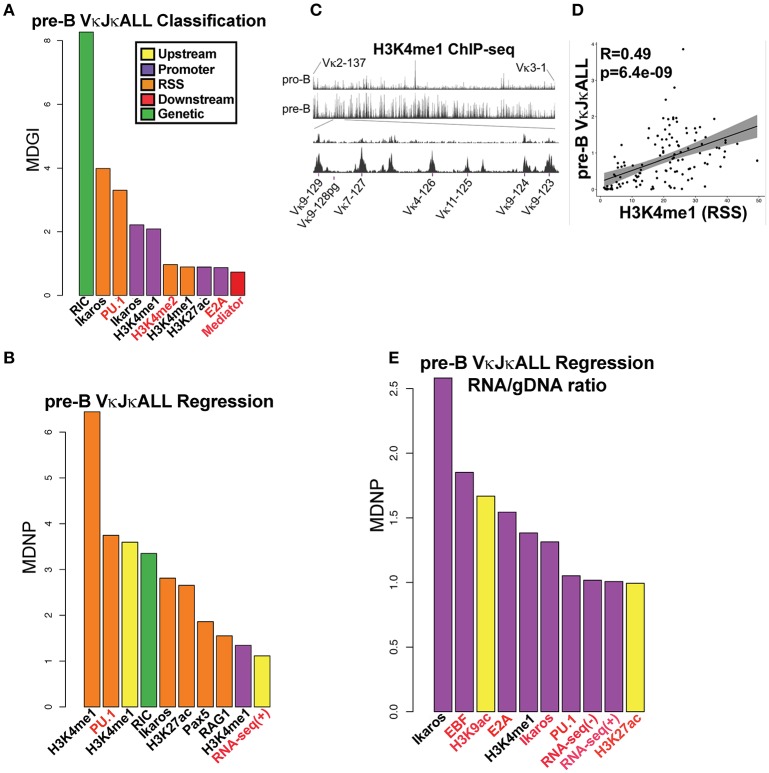
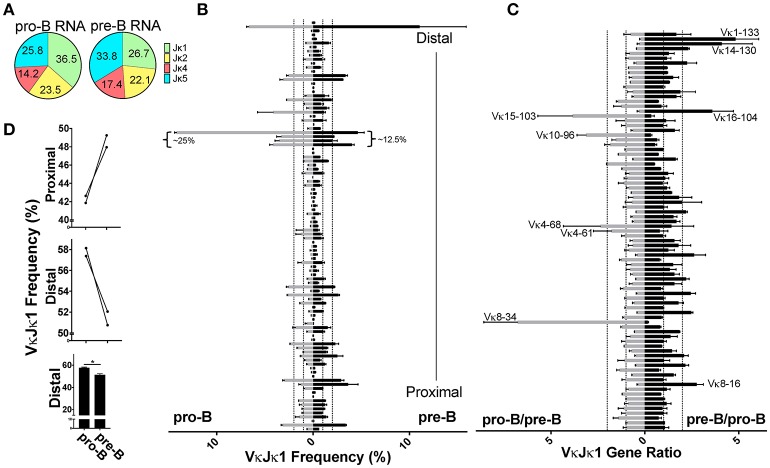
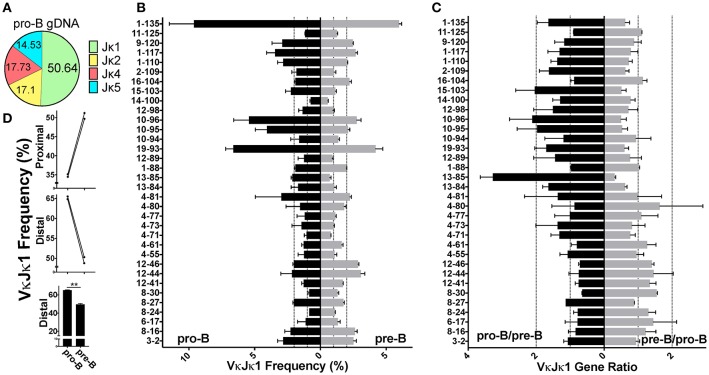
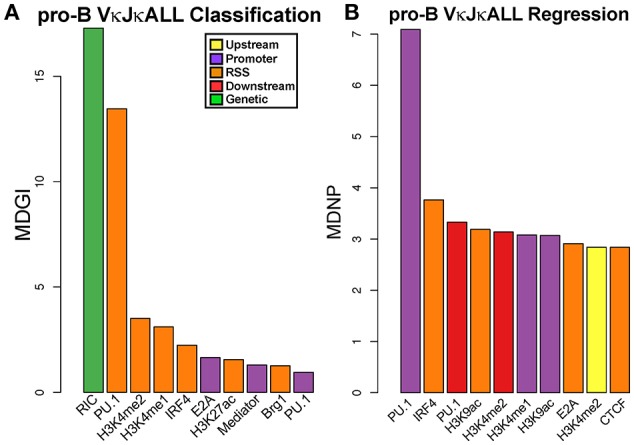
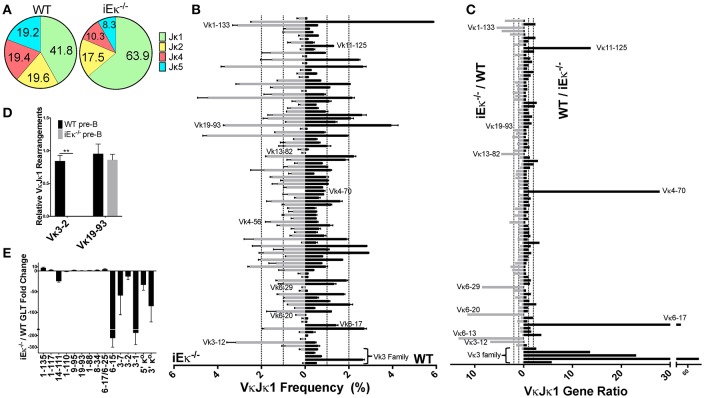
To date there has not been a study directly comparing relative Igκ rearrangement frequencies obtained from genomic DNA (gDNA) and cDNA and since each approach has potential biases, this is an important issue to clarify. Here we used deep sequencing to compare the unbiased gDNA and RNA Igκ repertoire from the same pre-B cell pool. We find that ~20% of Vκ genes have rearrangement frequencies ≥2-fold up or down in RNA vs. DNA libraries, including many members of the Vκ3, Vκ4, and Vκ6 families. Regression analysis indicates Ikaros and E2A binding are associated with strong promoters. Within the pre-B cell repertoire, we observed that individual Vκ genes rearranged at very different frequencies, and also displayed very different Jκ usage. Regression analysis revealed that the greatly unequal Vκ gene rearrangement frequencies are best predicted by epigenetic marks of enhancers. In particular, the levels of newly arising H3K4me1 peaks associated with many Vκ genes in pre-B cells are most predictive of rearrangement levels. Since H3K4me1 is associated with long range chromatin interactions which are created during locus contraction, our data provides mechanistic insight into unequal rearrangement levels. Comparison of Igκ rearrangements occurring in pro-B cells and pre-B cells from the same mice reveal a pro-B cell bias toward usage of Jκ-distal Vκ genes, particularly Vκ10-96 and Vκ1-135. Regression analysis indicates that PU.1 binding is the highest predictor of Vκ gene rearrangement frequency in pro-B cells. Lastly, the repertoires of iEκ-/- pre-B cells reveal that iEκ actively influences Vκ gene usage, particularly Vκ3 family genes, overlapping with a zone of iEκ-regulated germline transcription. These represent new roles for iEκ in addition to its critical function in promoting overall Igκ rearrangement. Together, this study provides insight into many aspects of Igκ repertoire formation.

Keywords: Next Generation Sequencing; V(D)J recombination; enhancer; immunoglobulin; pre-B cells; pro-B cells; repertoire.


Figures

Figure 1
Figure 1
Variation in VκJκ repertoires. (A) Scatterplot matrix showing correlation between VκJκ1, VκJκ2, VκJκ4, and VκJκ5 repertoires. Lower left panels depict scatterplot matrices. Upper right panels depict absolute correlation. The font size of the correlation value is proportional to the correlation. (B) Percentage of Jκ gene usage for each Vκ gene arranged vertically from Jκ-proximal (bottom) to Jκ-distal (top) genomic location. (C) Vκ gene rearrangement frequency arranged from Jκ-proximal (bottom) to Jκ-distal (top) with every other bar labeled on the left y-axis. Right side bars display VκJκALL gene frequencies, left side bars display VκJκ1 gene frequencies. Black bars depict deletional rearrangements, red bars depict inversional rearrangements. Genes with 0% rearrangement frequency in VκJκALL are excluded. Dotted vertical lines mark 1, 2, and 5% rearrangement frequency. (D) Rearrangement frequency ratios of VκJκ1/VκJκALL (left side) and the reciprocal VκJκALL/VκJκ1 ratios (right side). Vκ gene names listed are those that are >10-fold higher in VκJκALL vs. VκJκ1. All genes which had a VκJκALL frequency ≥0.05% in all 3 replicates are included. Vκ4-63Jκ1 was assigned a frequency equivalent to 1 read in order to calculate a ratio. (E) Jκ gene percent usage arranged in descending order of rearrangement frequency. The most highly rearranged genes are on top and the least frequently rearranged genes are at the bottom. Color coding as described in (B). For (A–E), data is derived from 3 independent pre-B cell gDNA biological replicates. For (B,E), only Vκ genes which had at least 5 reads in each of the 3 gDNA biological replicates are included. SEM error bars plotted for (C,D).
Figure 2
Figure 2
Comparison of VκJκALL gDNA and RNA repertoires in pre-B cells. (A) VκJκALL gDNA repertoire (left side) vs. VκJκALL RNA repertoire (right side) plotted in descending order from Jκ-distal (top) to Jκ-proximal (bottom) genomic location. Dotted vertical lines depict 1 and 2% frequencies. Genes with no reads in both gDNA and RNA repertoires are excluded. (B) Ratio of gDNA/RNA (left side) or RNA/gDNA (right side) for all IMGT-designated functional and ORF Vκ genes are arranged vertically as in (A). Dotted vertical lines depict 1 (no difference) and 2-fold changes for both ratios. Only genes that had reads in all 3 biological replicates for both gDNA and RNA are included. (C) Functional VκJκALL genes that are ≥2-fold greater in gDNA (left) or ≥2-fold greater in RNA (right) repertoires and ≥1.5-fold greater in each individual comparison. For (B,C), each pairing of gDNA and RNA derives from the same sorted pre-B cells. For (A–C), 3 biological replicates are used in both gDNA and RNA data. Errors bars represent SEM.
Figure 3
Figure 3
TFs predict rearranging Vκ genes and Vκ promoter strength while enhancer marks predict Vκ rearrangement frequency. (A) VI for each chromatin and RNA feature in a RF classification model for pre-B cell VκJκALL active/inactive genes. Vκ genes were categorized as active if they contained at least 15 reads per million reads among the VκJκALL read pool. Shown are the top ten features with significant VI. Mean Decrease in Gini Index (MDGI) is a measure of the decrease in accuracy if the feature is excluded. (B) VI for each chromatin and RNA feature in a RF Regression model for rearrangement frequency in pre-B cell VκJκALL active genes. Shown are features with significant VI. Mean Decrease in Node Purity (MDNP) is a measure of the decrease in accuracy if the feature is excluded. (C) H3K4me1 ChIP-seq data spanning the entire Vκ gene region comparing pro-B and pre-B cells (upper part). A zoom in of representative Jκ-distal region spanning genes Vκ9-123 to Vκ9-129 (lower part) illustrates the increase in H3K4me1 over Vκ genes in pre-B cells. Vκ9-128 is a pseudogene. (D) Scatterplot of H3K4me1 (within the RSS window) signal vs. VκJκALL pre-B gDNA rearrangement frequency, with linear regression line and 95% confidence interval using ggplot2 in R. Pearson correlation coefficient and associated p-value are also reported. (E) RF regression plot as in B for pre-B cell VκJκALL gene RNA/gDNA rearrangement frequency ratios. For (A,B,E), chromatin or RNA feature is listed below bar. ChIP-seq/RNA-seq datasets derived from pro-B cells are denoted in red font. Black labeled features are derived from pre-B cells.
Figure 4
Figure 4
Pro-B cell VκJκ1 RNA repertoire is biased to usage of the Jκ-distal half of the locus. (A) Pie chart indicating average percent Jκ gene usage in pre-B (3 biological replicates) and pro-B (2 biological replicates) cells. (B) Relative rearrangement frequencies in the VκJκ1 RNA repertoires of pro-B (left) and pre-B cells (right) arranged from Jκ-distal (top) to Jκ-proximal (bottom). Dotted vertical lines represent 1 and 2% rearrangement frequencies. Brackets mark the frequently rearranging Vκ genes 19-93 to 10-96. Only Vκ genes with at least one read in each sample are shown. (C) VκJκ1 rearrangement frequency ratios of pro-B/pre-B (left) and the reciprocal pre-B/pro-B (right) arranged vertically as in (B). Dotted vertical lines represent 1 (no difference) and 2-fold changes in rearrangement frequency. Only Vκ genes where both pro-B cell replicates had 0.05% frequency or greater are shown. For (B,C), only the 2 pre-B cell replicates that can be paired (from same sort) with the 2 pro-B cell replicates are used. (D) Comparison of pro-B and pre-B cell VκJκ1 RNA rearrangement frequency in the Jκ-distal half vs. Jκ-proximal half of the Igκ locus. Jκ-proximal Vκ genes include genes Vκ3-1 to Vκ13-76 (upper bar graph). Jκ-distal Vκ genes include Vκ4-77 to Vκ2-137 (center bar graph). Each line connects pro-B and pre-B cell values from the same mice. Lower bar graph compares the combined distal frequencies for both pro-B or pre-B cell replicates. Error bars represent SEM. *p < 0.05.
Figure 5
Figure 5
Pro-B cell gDNA rearrangements are biased to the Jκ-distal half of the kappa locus. (A) Pie chart indicating average percent Jκ gene usage in pro-B cells, from 2 biological replicates. (B) VκJκ1 gDNA repertoire frequencies of pro-B (left) and pre-B cells (right) arranged from Jκ-distal (top) to Jκ-proximal (bottom). Dotted vertical lines represent 1 and 2% rearrangement frequencies. Only Vκ genes comprising at least 0.5% of total rearrangements in both pro-B replicates were included. (C) VκJκ1 gDNA ratios of pro-B/pre-B (left) and the reciprocal pre-B/pro-B ratio (right) arranged vertically as in (B). Dotted vertical lines represent 1 (no difference) and 2-fold changes in relative gDNA rearrangement. (D) Comparison of pro-B and pre-B cell VκJκ1 rearrangements in the Jκ-distal half vs. Jκ-proximal half of the kappa locus as in 4D. Error bars represent SEM. **p < 0.01.
Figure 6
Figure 6
PU.1 predicts active Vκ genes and rearrangement frequency in pro-B cells. (A) VI for each chromatin and RNA feature in a RF classification model for pro-B cell gDNA VκJκALL active/inactive genes. Vκ genes were categorized as active if they contained at least 1 read. Shown are the top ten features with significant VI. (B) VI for each chromatin and RNA feature in a RF regression model for rearrangement frequency in pro-B cell gDNA VκJκALL active genes. Shown are features with significant VI. For (A,B), chromatin or RNA feature is listed below bar. All features used in RF are from pro-B cells.
Figure 7
Figure 7
iEκ regulates rearrangement of Vκ3 family genes. (A) Pie chart indicating the percent Jκ gene usage in WT and iEκ−/− pre-B cells. Data for WT is a combination of all 3 biological replicates, while the data for iEκ−/− represents a combination of 2 replicates. Percent Jκ usage is indicated. (B) VκJκ1 gene gDNA rearrangement frequency in WT (right) and iEκ−/− (left) pre-B cells. Labeled Vκ genes were most affected by the absence of iEκ. Only Vκ genes that are present at 0.1% or more in either WT or iEκ−/− cells are listed. Data are comprised of 2 WT replicates and 2 iEκ−/− replicates. (C) VκJκ1 gDNA gene ratios comparing WT and iEκ−/− cells, iEκ−/−/WT on the left, WT/iEκ−/− on the right. The 2 replicates of WT or iEκ−/− were combined to produce one value for a Vκ gene ratio. Only VκJκ1 genes that are at least 0.1% in WT are listed. Vκ genes in iEκ−/− pre-B cells which had a rearrangement frequency of 0 (when paired with WT genes that had a frequency ≥ 0.1) were replaced with the frequency equivalent of 1 read. Therefore, some of the WT/iEκ−/− ratios are an underrepresentation of the actual difference between the two. (D) TaqMan qPCR on sorted pre-B cell WT and iEκ−/− gDNA for Vκ 3-2Jκ1 or Vκ19-93Jκ1. Data was first normalized to heavy chain Eμ and then normalized to the total rearrangements using a degenerate Vκ binding primer “VκALL” (Materials and Methods). **p < 0.01. (E) qPCR showing GLT expression throughout the Igκ locus in CD19+ purified BM pre-B cells from iEκ−/− Rag−/− hIgH Tg and Rag−/− hIgH Tg control mice. Bars below the x axis indicate lower expression in iEκ−/− Rag−/− hIgH Tg relative to Rag−/− hIgH Tg control pre-B cells. Bars above the x axis indicate higher expression in iEκ−/− Rag−/− hIgH Tg pre-B cells. GLT expression was normalized to GAPDH. GLT data covering Vκ3-7, Vκ1-110, Vκ1-111, and Vκ1-117 genes was derived from 2 biological replicates, all other GLT data was derived from 3 biological replicates. (B–E) Error bars represent SEM.

Similar articles

Cited by

References

    1. Williams GS, Martinez A, Montalbano A, Tang A, Mauhar A, Ogwaro KM, et al. . Unequal VH gene rearrangement frequency within the large VH7183 gene family is not due to RSS variation, and mapping of the genes shows a bias of rearrangement based on chromosomal location. J Immunol. (2001) 167:257–63. 10.4049/jimmunol.167.1.257 - DOI - PubMed
    1. Feeney AJ, Atkinson MJ, Cowan MJ, Escuro G, Lugo G. A defective VkA2 allele in Navajos which may play a role in increased susceptibility to Haemophilus influenzae type b disease. J Clin Invest. (1996) 97:2277–82. 10.1172/JCI118669 - DOI - PMC - PubMed
    1. Feeney AJ, Lugo G, Escuro G. Human cord blood k repertoire. J Immunol. (1997) 158:3761–8. - PubMed
    1. Love VA, Lugo G, Merz D, Feeney AJ. Individual promoters vary in strength, but the frequency of rearrangement of those VH genes does not correlate with promoter strength nor enhancer independence. MolImmunol. (2000) 37:29–39. 10.1016/S0161-5890(00)00023-7 - DOI - PubMed
    1. Aoki-Ota M, Torkamani A, Ota T, Schork N, Nemazee D. Skewed primary Igkappa repertoire and V-J joining in C57BL/6 mice: implications for recombination accessibility and receptor editing. J Immunol. (2012) 188:2305–15. 10.4049/jimmunol.1103484 - DOI - PMC - PubMed

Publication types

MeSH terms

Substances