Protein oligomerization and mobility within the nuclear envelope evaluated by the time-shifted mean-segmented Q factor
- PMID: 30268407
- PMCID: PMC6401277
- DOI: 10.1016/j.ymeth.2018.09.008
Protein oligomerization and mobility within the nuclear envelope evaluated by the time-shifted mean-segmented Q factor
Abstract
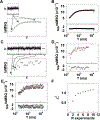
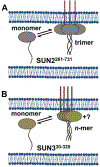
Analysis of fluorescence fluctuation experiments by the mean-segmented Q (MSQ) method was recently used to successfully characterize the oligomeric state and mobility of proteins within the nuclear envelope (NE) of living cells. However, two significant shortcomings of MSQ were recognized. Non-ideal detector behavior due to dead-time and afterpulsing as well as the lack of error analysis currently limit the potential of MSQ. This paper presents time-shifted MSQ (tsMSQ), a new formulation of MSQ that is robust with respect to dead-time and afterpulsing. In addition, a protocol for performing error analysis on tsMSQ data is introduced to assess the quality of fit models and estimate the uncertainties of fit parameters. Together, these developments significantly simplify and improve the analysis of fluorescence fluctuation data taken within the NE. To demonstrate these new developments, tsMSQ was used to characterize the oligomeric state and mobility of the luminal domains of two inner nuclear membrane SUN proteins. The results for the luminal domain of SUN2 obtained through tsMSQ without correction for non-ideal detector effects agree with a recent study that was conducted using the original MSQ formulation. Finally, tsMSQ was applied to characterize the oligomeric state and mobility of the luminal domain of the germline-restricted SUN3.
Copyright © 2018 Elsevier Inc. All rights reserved.
Conflict of interest statement
Declarations of interest: none
Figures


Similar articles
-
Identifying Heteroprotein Complexes in the Nuclear Envelope.Biophys J. 2020 Jan 7;118(1):26-35. doi: 10.1016/j.bpj.2019.11.020. Epub 2019 Nov 22. Biophys J. 2020. PMID: 31839257 Free PMC article.
-
Quantitative modeling of self-oligomerization of proteins in the nuclear envelope by fluorescence fluctuation analysis.Anal Biochem. 2019 Oct 1;582:113359. doi: 10.1016/j.ab.2019.113359. Epub 2019 Jul 4. Anal Biochem. 2019. PMID: 31279795 Free PMC article.
-
Time-shifted mean-segmented Q data of a luminal protein measured at the nuclear envelope by fluorescence fluctuation microscopy.Data Brief. 2019 Dec 20;28:105005. doi: 10.1016/j.dib.2019.105005. eCollection 2020 Feb. Data Brief. 2019. PMID: 32226805 Free PMC article.
-
The plant nuclear envelope in focus.Biochem Soc Trans. 2010 Feb;38(Pt 1):307-11. doi: 10.1042/BST0380307. Biochem Soc Trans. 2010. PMID: 20074080 Review.
-
Molecular models of LINC complex assembly at the nuclear envelope.J Cell Sci. 2021 Jun 15;134(12):jcs258194. doi: 10.1242/jcs.258194. Epub 2021 Jun 21. J Cell Sci. 2021. PMID: 34152389 Review.
Cited by
-
Differentiating Luminal and Membrane-Associated Nuclear Envelope Proteins.Biophys J. 2020 May 19;118(10):2385-2399. doi: 10.1016/j.bpj.2020.03.025. Epub 2020 Apr 8. Biophys J. 2020. PMID: 32304637 Free PMC article.
-
SUN4 is a spermatid type II inner nuclear membrane protein that forms heteromeric assemblies with SUN3 and interacts with lamin B3.J Cell Sci. 2023 Apr 1;136(7):jcs260155. doi: 10.1242/jcs.260155. Epub 2023 Mar 27. J Cell Sci. 2023. PMID: 36825599 Free PMC article.
-
Identifying Heteroprotein Complexes in the Nuclear Envelope.Biophys J. 2020 Jan 7;118(1):26-35. doi: 10.1016/j.bpj.2019.11.020. Epub 2019 Nov 22. Biophys J. 2020. PMID: 31839257 Free PMC article.
-
Building and breaking mechanical bridges between the nucleus and cytoskeleton: Regulation of LINC complex assembly and disassembly.Curr Opin Cell Biol. 2023 Dec;85:102260. doi: 10.1016/j.ceb.2023.102260. Epub 2023 Oct 17. Curr Opin Cell Biol. 2023. PMID: 37857179 Free PMC article. Review.
-
Autocorrelation function of finite-length data in fluorescence correlation spectroscopy.Biophys J. 2023 Jan 3;122(1):241-253. doi: 10.1016/j.bpj.2022.10.027. Epub 2022 Oct 20. Biophys J. 2023. PMID: 36266971 Free PMC article.
References
-
- Liu J, Rolef Ben-Shahar T, Riemer D, Treinin M, Spann P, Weber K, Fire A, Gruenbaum Y, Essential roles for Caenorhabditis elegans lamin gene in nuclear organization, cell cycle progression, and spatial organization of nuclear pore complexes, Mol. Biol. Cell 11 (2000) 3937–3947. doi:10.1091/mbc.11.11.3937. - DOI - PMC - PubMed
Publication types
MeSH terms
Substances
Grants and funding
LinkOut - more resources
Full Text Sources

