Renal reactivity: acid-base compensation during incremental ascent to high altitude
- PMID: 30267579
- PMCID: PMC6292812
- DOI: 10.1113/JP276973
Renal reactivity: acid-base compensation during incremental ascent to high altitude
Abstract
Key points: Ascent to high altitude imposes an acid-base challenge in which renal compensation is integral for maintaining pH homeostasis, facilitating acclimatization and helping prevent mountain sicknesses. The time-course and extent of plasticity of this important renal response during incremental ascent to altitude is unclear. We created a novel index that accurately quantifies renal acid-base compensation, which may have laboratory, fieldwork and clinical applications. Using this index, we found that renal compensation increased and plateaued after 5 days of incremental altitude exposure, suggesting plasticity in renal acid-base compensation mechanisms. The time-course and extent of plasticity in renal responsiveness may predict severity of altitude illness or acclimatization at higher or more prolonged stays at altitude.
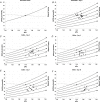
Abstract: Ascent to high altitude, and the associated hypoxic ventilatory response, imposes an acid-base challenge, namely chronic hypocapnia and respiratory alkalosis. The kidneys impart a relative compensatory metabolic acidosis through the elimination of bicarbonate (HCO3- ) in urine. The time-course and extent of plasticity of the renal response during incremental ascent is unclear. We developed an index of renal reactivity (RR), indexing the relative change in arterial bicarbonate concentration ([HCO3- ]a ) (i.e. renal response) against the relative change in arterial pressure of CO2 ( ) (i.e. renal stimulus) during incremental ascent to altitude ( ). We aimed to assess whether: (i) RR magnitude was inversely correlated with relative changes in arterial pH (ΔpHa ) with ascent and (ii) RR increased over time and altitude exposure (i.e. plasticity). During ascent to 5160 m over 10 days in the Nepal Himalaya, arterial blood was drawn from the radial artery for measurement of blood gas/acid-base variables in lowlanders at 1045/1400 m and after 1 night of sleep at 3440 m (day 3), 3820 m (day 5), 4240 m (day 7) and 5160 m (day 10) during ascent. At 3820 m and higher, RR significantly increased and plateaued compared to 3440 m (P < 0.04), suggesting plasticity in renal acid-base compensations. At all altitudes, we observed a strong negative correlation (r ≤ -0.71; P < 0.001) between RR and ΔpHa from baseline. Renal compensation plateaued after 5 days of altitude exposure, despite subsequent exposure to higher altitudes. The time-course, extent of plasticity and plateau in renal responsiveness may predict severity of altitude illness or acclimatization at higher or more prolonged stays at altitude.
Keywords: Acid-Base Physiology; High Altitude; Metabolic Acidosis; Renal Compensation; Respiratory Alkalosis.
© 2018 The Authors. The Journal of Physiology © 2018 The Physiological Society.
Figures


Similar articles
-
Time course and magnitude of ventilatory and renal acid-base acclimatization following rapid ascent to and residence at 3,800 m over nine days.J Appl Physiol (1985). 2021 Jun 1;130(6):1705-1715. doi: 10.1152/japplphysiol.00973.2020. Epub 2021 Mar 11. J Appl Physiol (1985). 2021. PMID: 33703943 Free PMC article.
-
Comparing integrative ventilatory and renal acid-base acclimatization in lowlanders and Tibetan highlanders during ascent to 4,300 m.Proc Natl Acad Sci U S A. 2025 Jan 7;122(1):e2412561121. doi: 10.1073/pnas.2412561121. Epub 2024 Dec 30. Proc Natl Acad Sci U S A. 2025. PMID: 39793031
-
Steady-state cerebral blood flow regulation at altitude: interaction between oxygen and carbon dioxide.Eur J Appl Physiol. 2019 Dec;119(11-12):2529-2544. doi: 10.1007/s00421-019-04206-6. Epub 2019 Sep 26. Eur J Appl Physiol. 2019. PMID: 31559499
-
Bicarbonate Values for Healthy Residents Living in Cities Above 1500 Meters of Altitude: A Theoretical Model and Systematic Review.High Alt Med Biol. 2016 Jun;17(2):85-92. doi: 10.1089/ham.2015.0097. Epub 2016 Apr 27. High Alt Med Biol. 2016. PMID: 27120676 Review.
-
Altitude preexposure recommendations for inducing acclimatization.High Alt Med Biol. 2010 Summer;11(2):87-92. doi: 10.1089/ham.2010.1006. High Alt Med Biol. 2010. PMID: 20586592 Review.
Cited by
-
Acid-Base Disturbances in Patients with Asthma: A Literature Review and Comments on Their Pathophysiology.J Clin Med. 2019 Apr 25;8(4):563. doi: 10.3390/jcm8040563. J Clin Med. 2019. PMID: 31027265 Free PMC article. Review.
-
Using modified Fenn diagrams to assess ventilatory acclimatization during ascent to high altitude: Effect of acetazolamide.Exp Physiol. 2024 Jul;109(7):1080-1098. doi: 10.1113/EP091748. Epub 2024 May 15. Exp Physiol. 2024. PMID: 38747161 Free PMC article.
-
Altitude illnesses.Nat Rev Dis Primers. 2024 Jun 20;10(1):43. doi: 10.1038/s41572-024-00526-w. Nat Rev Dis Primers. 2024. PMID: 38902312 Review.
-
Cardiorespiratory function, resting metabolic rate and heart rate variability in coal miners exposed to hypobaric hypoxia in highland workplace.PeerJ. 2022 Aug 30;10:e13899. doi: 10.7717/peerj.13899. eCollection 2022. PeerJ. 2022. PMID: 36061757 Free PMC article.
-
Ginsenosides ameliorates high altitude-induced hypoxia injury in lung and kidney tissues by regulating PHD2/HIF-1α/EPO signaling pathway.Front Pharmacol. 2024 Jul 18;15:1396231. doi: 10.3389/fphar.2024.1396231. eCollection 2024. Front Pharmacol. 2024. PMID: 39101138 Free PMC article.
References
-
- Al‐Awqati Q (2003). Terminal differentiation of intercalated cells: the role of hensin. Annu Rev Physiol 65, 567–583. - PubMed
-
- Bagnis C, Marshansky V, Breton S & Brown D (2001). Remodeling the cellular profile of collecting ducts by chronic carbonic anhydrase inhibition. Am J Physiol Renal Physiol 280, F437–F448. - PubMed
-
- Bartsch P, Maggiorini M, Schobersberger W, Shaw S, Rascher W, Girard J, Weidmann P & Oelz O (1991). Enhanced exercise‐induced rise of aldosterone and vasopressin preceding mountain sickness. J Appl Physiol 71, 136–143. - PubMed
-
- Berg MD & Meyer RJ (2008). Gas exchange and acid‐base physiology In Pediatric Respiratory Medicine, 2nd edn, ed. Taussig LM. & Landau LI, pp. 179–200. Mosby, Philadelphia, PA.
Publication types
MeSH terms
Substances
Grants and funding
- Alberta Government Student Temporary Employment Program (SMZ)/International
- Alberta Innovates Health Solutions Summer Studentship (CEN)/International
- Natural Sciences and Engineering Research Council of Canada (NSERC) Undergraduate Research Student Assistantship (SMZ; HCL)/International
- 2016-04915/NSERC Discovery grant (TAD; RGPIN/International
- RGPIN-2016-04915/Gouvernement du Canada | Natural Sciences and Engineering Research Council of Canada (Conseil de Recherches en Sciences Naturelles et en Génie du Canada)/International
LinkOut - more resources
Full Text Sources
Other Literature Sources

