TET2 deficiency leads to stem cell factor-dependent clonal expansion of dysfunctional erythroid progenitors
- PMID: 30254129
- PMCID: PMC6265651
- DOI: 10.1182/blood-2018-05-853291
TET2 deficiency leads to stem cell factor-dependent clonal expansion of dysfunctional erythroid progenitors
Abstract
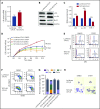
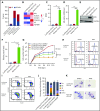
Myelodysplastic syndromes (MDSs) are clonal hematopoietic stem cell disorders characterized by ineffective hematopoiesis. Anemia is the defining cytopenia of MDS patients, yet the molecular mechanisms for dyserythropoiesis in MDSs remain to be fully defined. Recent studies have revealed that heterozygous loss-of-function mutation of DNA dioxygenase TET2 is 1 of the most common mutations in MDSs and that TET2 deficiency disturbs erythroid differentiation. However, mechanistic insights into the role of TET2 on disordered erythropoiesis are not fully defined. Here, we show that TET2 deficiency leads initially to stem cell factor (SCF)-dependent hyperproliferation and impaired differentiation of human colony-forming unit-erythroid (CFU-E) cells, which were reversed by a c-Kit inhibitor. We further show that this was due to increased phosphorylation of c-Kit accompanied by decreased expression of phosphatase SHP-1, a negative regulator of c-Kit. At later stages, TET2 deficiency led to an accumulation of a progenitor population, which expressed surface markers characteristic of normal CFU-E cells but were functionally different. In contrast to normal CFU-E cells that require only erythropoietin (EPO) for proliferation, these abnormal progenitors required SCF and EPO and exhibited impaired differentiation. We termed this population of progenitors "marker CFU-E" cells. We further show that AXL expression was increased in marker CFU-E cells and that the increased AXL expression led to increased activation of AKT and ERK. Moreover, the altered proliferation and differentiation of marker CFU-E cells were partially rescued by an AXL inhibitor. Our findings document an important role for TET2 in erythropoiesis and have uncovered previously unknown mechanisms by which deficiency of TET2 contributes to ineffective erythropoiesis.
© 2018 by The American Society of Hematology.
Conflict of interest statement
Conflict-of-interest disclosure: The authors declare no competing financial interests.
Figures


Comment in
-
Ineffective erythropoiesis of TET2 deficiency.Blood. 2018 Nov 29;132(22):2320-2321. doi: 10.1182/blood-2018-10-878645. Blood. 2018. PMID: 30498069 Free PMC article.
Similar articles
-
Distinct roles for TET family proteins in regulating human erythropoiesis.Blood. 2017 Apr 6;129(14):2002-2012. doi: 10.1182/blood-2016-08-736587. Epub 2017 Feb 6. Blood. 2017. PMID: 28167661 Free PMC article.
-
Functional interaction of erythropoietin and stem cell factor receptors is essential for erythroid colony formation.Proc Natl Acad Sci U S A. 1997 Mar 4;94(5):1806-10. doi: 10.1073/pnas.94.5.1806. Proc Natl Acad Sci U S A. 1997. PMID: 9050860 Free PMC article.
-
In vitro proliferation and differentiation of erythroid progenitors from patients with myelodysplastic syndromes: evidence for Fas-dependent apoptosis.Blood. 2002 Mar 1;99(5):1594-601. doi: 10.1182/blood.v99.5.1594. Blood. 2002. PMID: 11861273
-
Role of c-Kit and erythropoietin receptor in erythropoiesis.Crit Rev Oncol Hematol. 2005 Apr;54(1):63-75. doi: 10.1016/j.critrevonc.2004.11.005. Crit Rev Oncol Hematol. 2005. PMID: 15780908 Review.
-
Characterization, regulation, and targeting of erythroid progenitors in normal and disordered human erythropoiesis.Curr Opin Hematol. 2017 May;24(3):159-166. doi: 10.1097/MOH.0000000000000328. Curr Opin Hematol. 2017. PMID: 28099275 Free PMC article. Review.
Cited by
-
Role of TET dioxygenases in the regulation of both normal and pathological hematopoiesis.J Exp Clin Cancer Res. 2022 Oct 7;41(1):294. doi: 10.1186/s13046-022-02496-x. J Exp Clin Cancer Res. 2022. PMID: 36203205 Free PMC article. Review.
-
Loss of Tet2 affects platelet function but not coagulation in mice.Blood Sci. 2020 Oct 23;2(4):129-136. doi: 10.1097/BS9.0000000000000055. eCollection 2020 Oct. Blood Sci. 2020. PMID: 35400021 Free PMC article.
-
STING activation in TET2-mutated hematopoietic stem/progenitor cells contributes to the increased self-renewal and neoplastic transformation.Leukemia. 2023 Dec;37(12):2457-2467. doi: 10.1038/s41375-023-02055-z. Epub 2023 Oct 10. Leukemia. 2023. PMID: 37816954 Free PMC article.
-
TET-dioxygenase deficiency in oncogenesis and its targeting for tumor-selective therapeutics.Semin Hematol. 2021 Jan;58(1):27-34. doi: 10.1053/j.seminhematol.2020.12.002. Epub 2020 Dec 28. Semin Hematol. 2021. PMID: 33509440 Free PMC article. Review.
-
Knockdown of spliceosome U2AF1 significantly inhibits the development of human erythroid cells.J Cell Mol Med. 2019 Aug;23(8):5076-5086. doi: 10.1111/jcmm.14370. Epub 2019 May 29. J Cell Mol Med. 2019. PMID: 31144421 Free PMC article.
References
-
- Finch CA, Sturgeon P. Erythrokinetics in Cooley’s anemia. Blood. 1957;12(1):64-73. - PubMed
-
- Kean LS, Brown LE, Nichols JW, Mohandas N, Archer DR, Hsu LL. Comparison of mechanisms of anemia in mice with sickle cell disease and beta-thalassemia: peripheral destruction, ineffective erythropoiesis, and phospholipid scramblase-mediated phosphatidylserine exposure. Exp Hematol. 2002;30(5):394-402. - PubMed
-
- Wickramasinghe SN, Wood WG. Advances in the understanding of the congenital dyserythropoietic anaemias. Br J Haematol. 2005;131(4):431-446. - PubMed
-
- Heimpel H, Schwarz K, Ebnöther M, et al. . Congenital dyserythropoietic anemia type I (CDA I): molecular genetics, clinical appearance, and prognosis based on long-term observation. Blood. 2006;107(1):334-340. - PubMed
Publication types
MeSH terms
Substances
Grants and funding
LinkOut - more resources
Full Text Sources
Other Literature Sources
Medical
Research Materials
Miscellaneous

