. 2018 Dec;94(6):1127-1140.
doi: 10.1016/j.kint.2018.06.025. Epub 2018 Sep 21.

CD8+ T cells modulate autosomal dominant polycystic kidney disease progression

Affiliations

CD8+ T cells modulate autosomal dominant polycystic kidney disease progression

Emily K Kleczko et al. Kidney Int. 2018 Dec.

Abstract

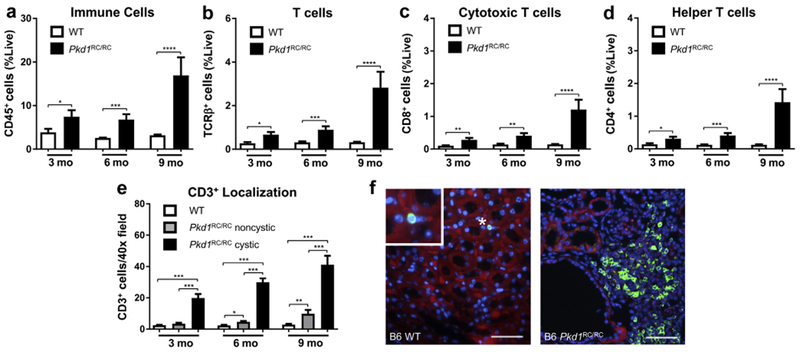
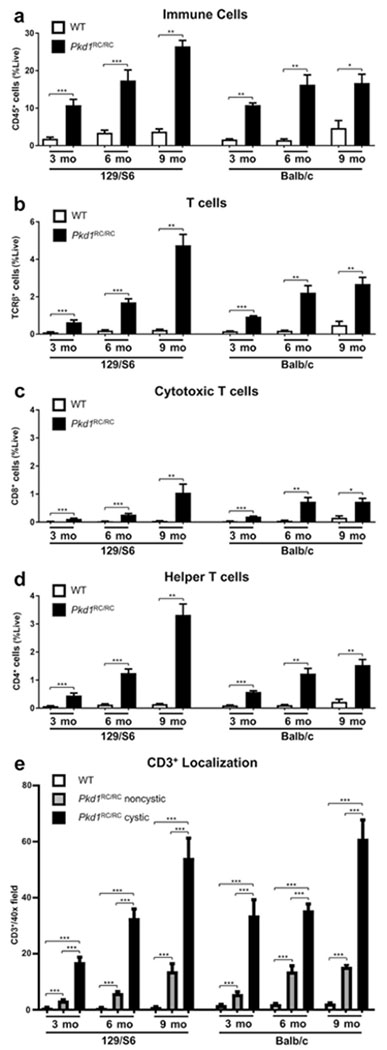
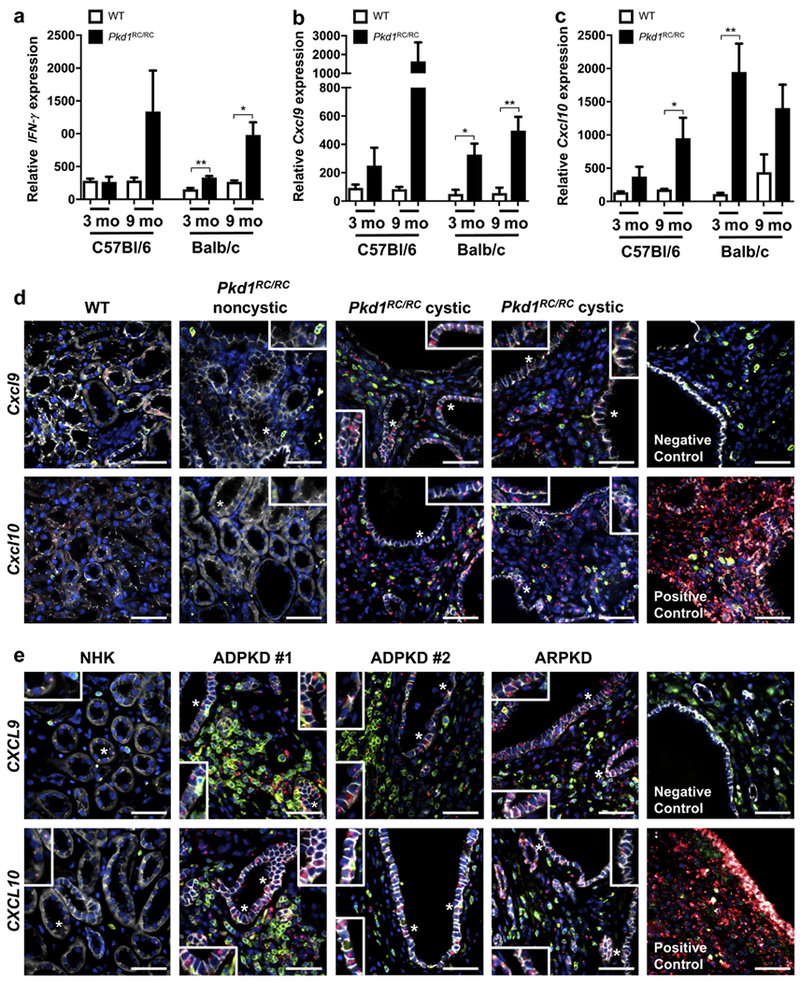
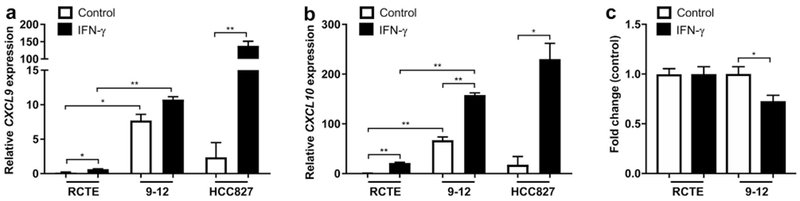
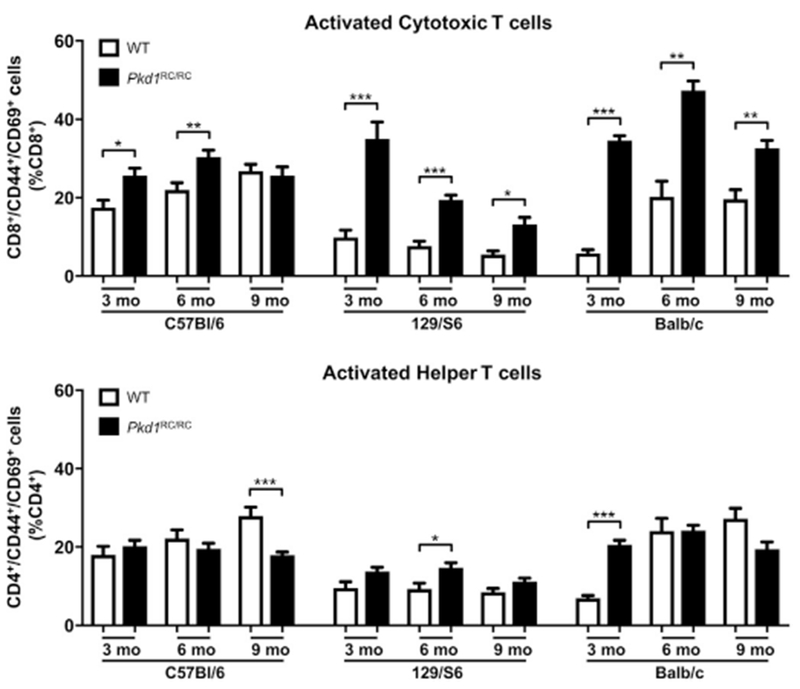
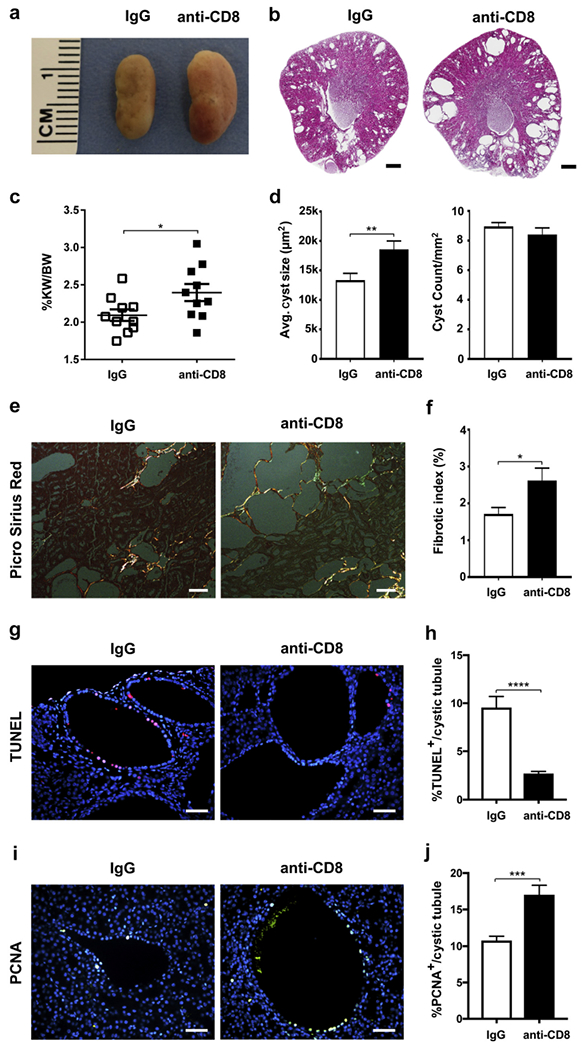
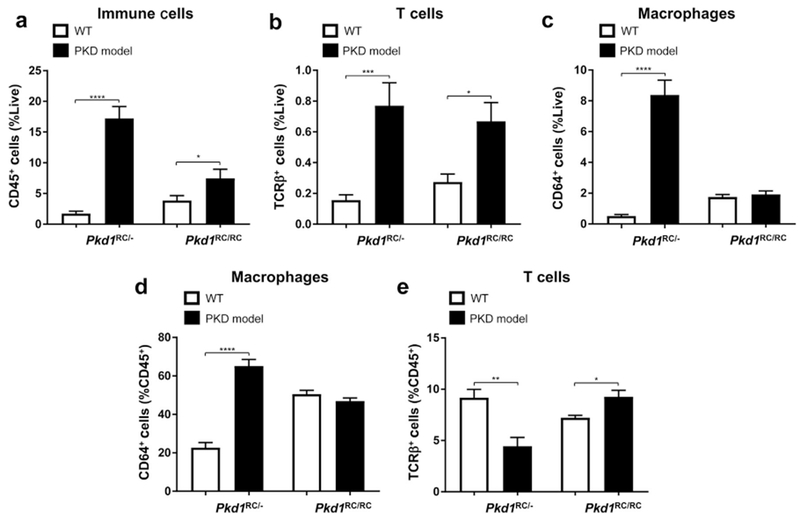
Autosomal dominant polycystic kidney disease (ADPKD) is the most prevalent inherited nephropathy. To date, therapies alleviating the disease have largely focused on targeting abnormalities in renal epithelial cell signaling. ADPKD has many hallmarks of cancer, where targeting T cells has brought novel therapeutic interventions. However, little is known about the role and therapeutic potential of T cells in ADPKD. Here, we used an orthologous ADPKD model, Pkd1 p.R3277C (RC), to begin to define the role of T cells in disease progression. Using flow cytometry, we found progressive increases in renal CD8+ and CD4+ T cells, correlative with disease severity, but with selective activation of CD8+ T cells. By immunofluorescence, T cells specifically localized to cystic lesions and increased levels of T-cell recruiting chemokines (CXCL9/CXCL10) were detected by qPCR/in situ hybridization in the kidneys of mice, patients, and ADPKD epithelial cell lines. Importantly, immunodepletion of CD8+ T cells from one to three months in C57Bl/6 Pkd1RC/RC mice resulted in worsening of ADPKD pathology, decreased apoptosis, and increased proliferation compared to IgG-control, consistent with a reno-protective role of CD8+ T cells. Thus, our studies suggest a functional role for T cells, specifically CD8+ T cells, in ADPKD progression. Hence, targeting this pathway using immune-oncology agents may represent a novel therapeutic approach for ADPKD.

Keywords: CD8(+) T cells; Pkd1 RC mouse model; adaptive immunity; autosomal dominant polycystic kidney disease.


Conflict of interest statement

DISCLOSURE

All the authors declared no competing interests.

Figures

Figure 1
Figure 1. Autosomal dominant polycystic kidney disease (ADPKD) pathology triggers an increase of the adaptive immune system in the C57Bl/6 Pkd1RC/RC model.
Wild type (WT) and Pkd1RC/RC C57Bl/6 mice were aged to 3, 6, and 9 months and flow cytometry of a renal single cell suspension was used to assess differences in the adaptive immune system at varying disease stages. An increase in immune cells (CD45+) (a), T cells (T-cell receptor β+ [TCRβ+]) (b), cytotoxic T cells (CD8+) (c), and helper T cells (CD4+) (d) was observed in Pkd1RC/RC mice compared with WT control subjects across all 3 time points, but the increase was most striking at 9 months. Immunofluorescence (IF) imaging of formalin-fixed paraffin embedded tissue showed specific localization of T cells (CD3+, comparable marker to TCRβ) near cystic lesions rather than normal tissue even at early disease stages where the overall increase in T-cell numbers was modest (e). (f) Representative IF images showing CD3+ localization near cystic epithelium in a 6-month-old C57Bl/6 Pkd1RC/RC mouse (4′,6-diamidino-2-phenylindole [DAPI] = blue; CD3 = green; E-cadherin = red; bar = 50 μm). Data are represented as mean ± SEM, and a nonparametric Mann-Whitney test was performed on the data. *P ≤ 0.05; **P ≤ 0.01; ***P ≤ 0.001; ****P ≤ 0.0001. N = 10 mice per group (5 females, 5 males). To optimize viewing of this image, please see the online version of this article at www.kidney-international.org.
Figure 2
Figure 2. The increase of renal adaptive immune cells is augmented in strains with more severe autosomal dominant polycystic kidney disease (ADPKD).
Renal single cell suspensions of wild type (WT) and Pkd1RC/RC 129/S6 and Balb/c mice were analyzed in the same manner as for the C57Bl/6 strain. A more rapid increase, notably at younger ages, of CD45+ (a), T-cell receptor β+ (TCRR+) (b), CD8+ (c), and CD4+ (d) cells was observed in the Pkd1RC/RC compared with WT mice of these strains with more rapidly progressive disease. Immunofluorescence quantification of CD3+ T cells shows a larger number of positive cells near cystic lesions from a very young age on and only a modest increase over time, correlating with the high cystic burden these animals present with at 3 months (e). Data are represented as mean ± SEM, and a nonparametric Mann-Whitney test was performed on the data. *P ≤ 0.05; **P ≤ 0.01; ***P ≤ 0.001. N ≥ 6 mice per group (one-half females, one-half males).
Figure 3
Figure 3. T-cell recruiting chemokines and T-cell secreted cytokines are increased in autosomal dominant polycystic kidney disease (ADPKD).
Quantitative polymerase chain reaction (qPCR) of RNA isolated from whole kidney pieces of wild type (WT) and Pkd1RC/RC mice showed increased levels of interferon (IFN)-γ, a cytokine secreted by CD8+ T cells (a) and chemokines known to recruit T cells (b, Cxcl9 and c, Cxcl10) when comparing Pkd1RC/RC with WT mice in both the mild C57Bl/6 and the severe Balb/c background (relative cytokine/chemokine levels may not correlate to disease severity because RNA was isolated from only a small kidney piece, ignoring the nonhomogeneous nature of the disease). (d) Representative in situ hybridization images of 3-month-old Balb/c mice. In WT mice, staining for Cxcl9/Cxcl10 (red) with immunofluorescent co-staining for CD3 (green) and E-cadherin (white) showed no Cxcl9/Cxcl10 expression in microenvironmental cells or renal tubules; 4’,6-diamidino-2-phenylindole [DAPI] = blue. Little Cxcl9/Cxcl10 was detected in noncystic regions of Pkd1RC/RC mice; however, much higher levels of the chemokines were observed in cystic regions where significant numbers of T cells accumulate. Interestingly, both chemokines were also produced by the cystic epithelium and not only by cells within the cystic microenvironment (insets). (e) T-cell infiltration to cystic regions and CXCL9/CXCL10 production by microenvironmental cells and tubular epithelium (insets) were confirmed in human formalin-fixed, paraffin-embedded (FFPE) tissue. Very few T cells (CD3 = green) were infiltrating normal human kidneys (NHKs), and only low levels of CXCL9/CXCL10 (in situ = red) could be detected within the microenvironment or epithelium (E-cadherin = white; 4’,6-diamidino-2-phenylindole [DAPI] = blue). As for Pkd1RC/RC mice, the number of renal T cells were significantly increased in ADPKD/ARPKD patient tissue versus NHK and located predominantly to cystic regions. Here also, significant levels of both chemokines could be detected in the microenvironment and tubular epithelium. Staining of positive and negative control probes for in situ staining are shown. Data are represented as mean ± SEM, and a nonparametric Mann-Whitney test was performed on the data. *P ≤ 0.05; **P ≤ 0.01. N ≥ 6 mice per group (one-half females, one-half males). Bar = 50 μm. ARPDK, autosomal recessive polycystic kidney disease. To optimize viewing of this image, please see the online version of this article at www.kidney-international.org.
Figure 4
Figure 4. Interferon (IFN)-γ stimulates chemokine production and inhibits cell proliferation in autosomal dominant polycystic kidney disease (ADPKD) epithelial cells.
IFN-γ treatment for 24 hours of renal cortical tubular epithelial (RCTE) (PKD1+/+) and 9-12 (PKD1−/−) epithelial cells stimulated expression of CXCL9 (a) and CXCL10 (b) mRNA as shown in vivo in Pkd1RC/RC mice, confirming the ability of tubular epithelia to produce these chemokines. Interestingly, 9-12 cells produced significantly higher basal levels of the chemokines compared with RCTE control cells. The lung adenocarcinoma cell line HCC827 was used as a positive control for the induction of CXCL9/CXCL10 after IFN-γ stimulation. (c) RCTE (PKD1+/+) and 9-12 (PKD1−/−) cells were treated with IFN-γ for 72 hours followed by assessment of cell count. The 9-12 cells treated with IFN-γ had a lower cell count compared with RCTE cells, consistent with an antiproliferative role of IFN-γ. The cell count was normalized to control-treated. Data are represented as mean ± SEM, and a unpaired t-test was performed on the data.*P ≤ 0.05; **P ≤ 0.01.
Figure 5
Figure 5. CD8+ T cells are predominantly activated in the Pkd1RC/RC mouse model of autosomal dominant polycystic kidney disease (ADPKD).
Wild type (WT) and Pkd1RC/RC mice were aged to 3,6, and 9 months and flow cytometry of a renal single cell suspension was used to assess differences in activation of CD8+ and CD4+ T cells at varying disease stages. In all 3 strains, CD8+ T cells were preferentially activated based on the T-cell activation markers CD44/CD69 at early disease stages. Comparably, CD4+ T cells did not show an increase in activation relative to WT at any disease stage. Importantly, CD8+ T cells were significantly more activated in 129/S6 and Balb/c ADPKD mice, correlative with their higher disease burden. Data are represented as mean ± SEM, and a nonparametric Mann-Whitney test was performed on the data. *P ≤ 0.05; **P ≤ 0.01; ***P ≤ 0.001. N ≥ 6 mice per group (one-half females, one-half males).
Figure 6
Figure 6. CD8+ T-cell depletion exacerbates cystic disease in C57BI/6 Pkd1RC/RC mice.
One-month-old C57Bl/6 Pkd1RC/RC mice were treated by i.p. injection weekly for 8 weeks with a CD8-depIeting antibody (10 mg/kg) or IgG control. Depletion of CD8+ T cells worsened cystic disease as apparent by gross anatomy/histology (a,b), and significantly increased percent kidney weight/body weight (%KW/BW) (c), average cyst size (d), and fibrosis (% fibrotic area/[renal area – cystic area]) (e,f). Although average cyst size increased, cyst count remained unchanged between the treated and control groups (d), indicating that CD8+ T cells are important in cyst progression but not initiation. (e) Representative images of Picro Sirius red-stained renal histology sections visualized under polarized light to highlight collagen fibers. (g,h) In line with CD8+ T-cell-mediated cytotoxicity, terminal deoxynucleotidyltransferase–mediated dUTP nick end-labeling (TUNEL) staining revealed a significant decrease in apoptotic epithelial cell numbers within dilated/cystic tubules of anti-CD8 treated animals versus IgG control, suggesting that programmed cell death is an essential mechanism through which CD8+ T cells control cyst growth (g, representative images of immunofluorescent [IF] TUNEL staining, TUNEL = red, 4’,6-diamidino-2-phenylindole [DAPI] = blue). (i,j) Concurrent with the in vitro results that interferon (IFN)-γ reduces epithelial proliferation (Figure 4), dilated/cystic tubules of anti-CD8 treated C57Bl/6 Pkd1RC/RC mice have significantly higher numbers of proliferating cell nuclear antigen (PCNA) positive epithelial cells versus IgG control. (i, Representative images of IF PCNA staining, PCNA = green, DAPI = blue.) Bars = 500 μm (b), 100 μm (e), and 50 μm (g,i). Data are represented as mean ± SEM, and a nonparametric Mann-Whitney test was performed on the data. *P ≤ 0.05; **P ≤ 0.01; ***P ≤ 0.001; ****P ≤ 0.0001. (c,d,f) N = 10 mice per group (5 females, 5 males), (h,j) N = 3 mice per group. To optimize viewing of this image, please see the online version of this article at www.kidney-international.org.
Figure 7
Figure 7. In a rapidly progressive autosomal dominant polycystic kidney disease (ADPKD) model, macrophages predominantly account for the rise in immune cells associated with disease.
Both C57Bl/6 Pkd1RC/− mice (postnatal [P] 20) and Pkd1RC/RC mice (3 months) presented with an increase in CD45+ cells compared with wild type (WT); however, the fold increase is more pronounced in the rapidly progressive disease (a). Although T-cell numbers increase in both models (b), the increase in macrophage numbers account for the majority of the increase in CD45+ cells in the Pkd1RC/− model (c,d,e). Thus these data indicate that the microenvironment in the Pkd1RC/− model is highly inflamed, with macrophages being likely one of the key players in disease progression. Further, the adaptive and innate immune system may have a different interplay and role in cystogenesis in the rapid versus slow model of ADPKD. Data are represented as mean ± SEM, and a nonparametric Mann-Whitney test was performed on the data. *P ≤ 0.05; **P ≤ 0.01; ***P ≤ 0.001; ****P ≤ 0.0001. N ≥ 8 mice per group (one-half females, one-half males).

Similar articles

Cited by

References

    1. Grantham JJ. Mechanisms of progression in autosomal dominant polycystic kidney disease. Kidney Int Suppl. 1997;63:S93–S97. - PubMed
    1. Grantham JJ, Chapman AB, Torres VE. Volume progression in autosomal dominant polycystic kidney disease: the major factor determining clinical outcomes. Clin J Am Soc Nephrol. 2006;1:148–157. - PubMed
    1. Heyer CM, Sundsbak JL, Abebe KZ, et al. Predicted mutation strength of nontruncating PKD1 mutations aids genotype-phenotype correlations in autosomal dominant polycystic kidney disease. J Am Soc Nephrol. 2016;27:2872–2884. - PMC - PubMed
    1. Porath B, Gainullin VG, Cornec-Le Gall E, et al. Mutations in GANAB, encoding the glucosidase IIalpha subunit, cause autosomal-dominant polycystic kidney and liver disease. Am J Hum Genet. 2016;98:1193–1207. - PMC - PubMed
    1. Grantham JJ. Clinical practice. Autosomal dominant polycystic kidney disease. N Engl J Med. 2008;359:1477–1485. - PubMed

Publication types

MeSH terms

Substances

LinkOut - more resources