

Characterization of eomesodermin and T-bet expression by allostimulated CD8+ T cells of healthy volunteers and kidney transplant patients in relation to graft outcome
- PMID: 30246373
- PMCID: PMC6194331
- DOI: 10.1111/cei.13162
Characterization of eomesodermin and T-bet expression by allostimulated CD8+ T cells of healthy volunteers and kidney transplant patients in relation to graft outcome
Abstract
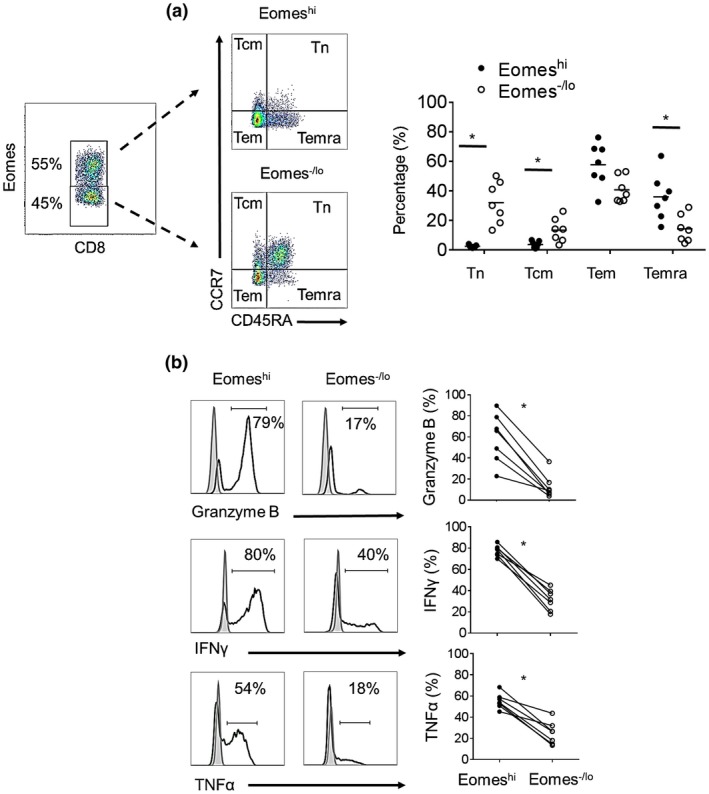
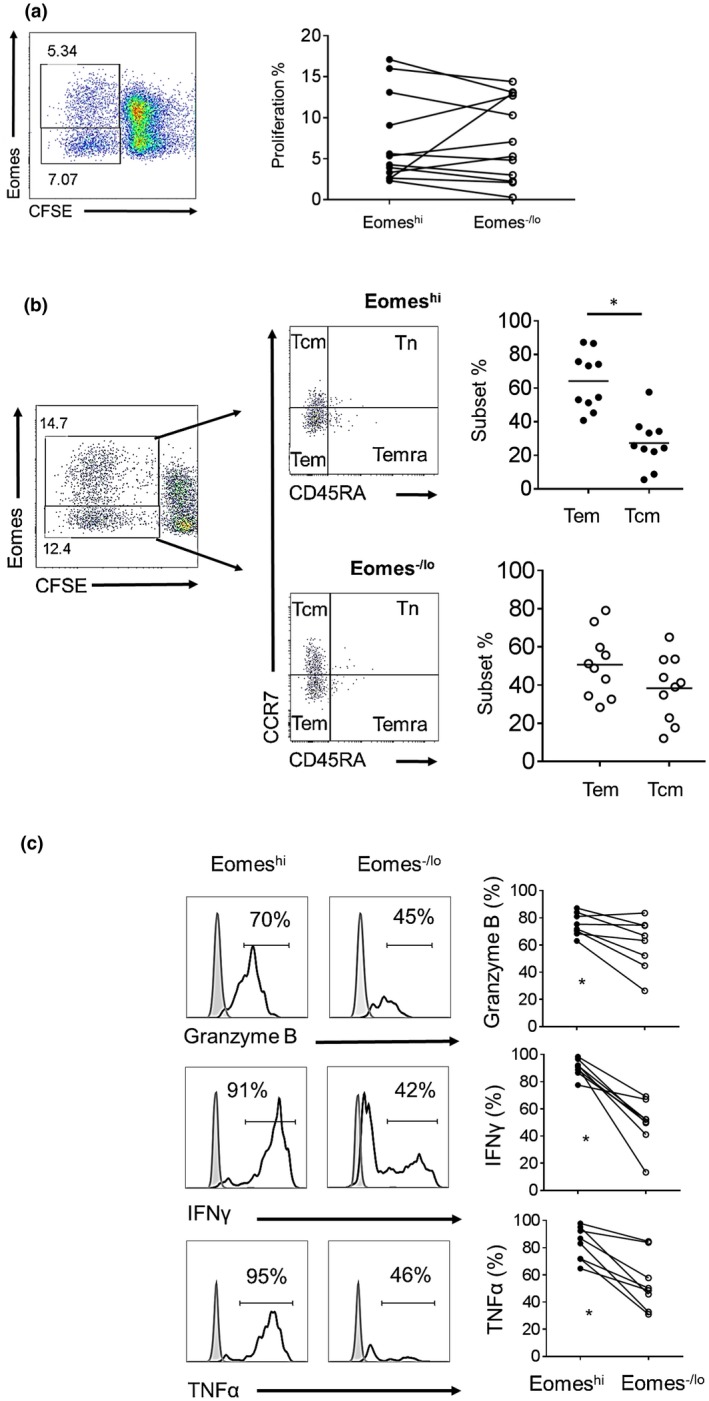
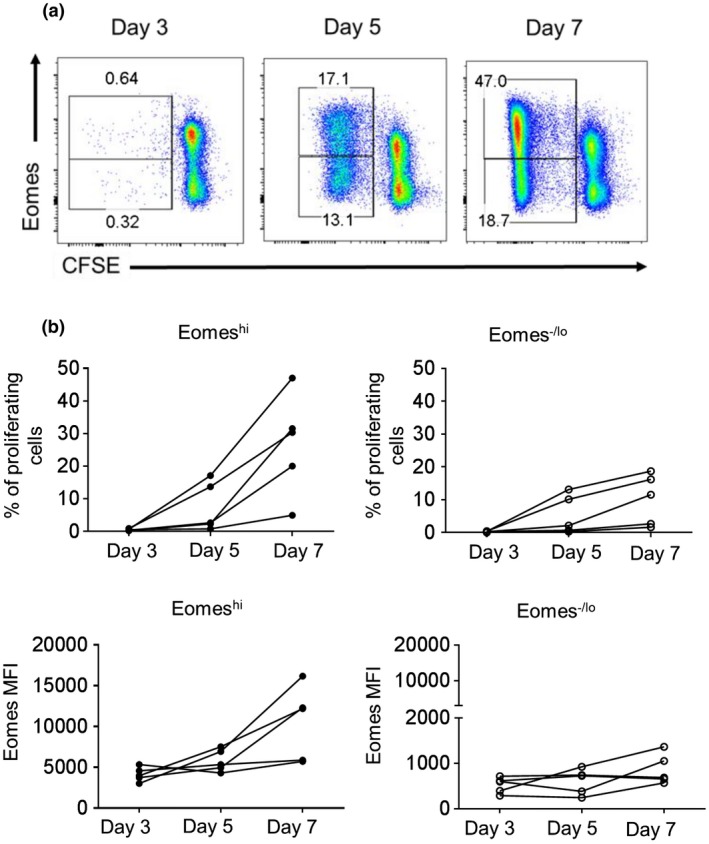
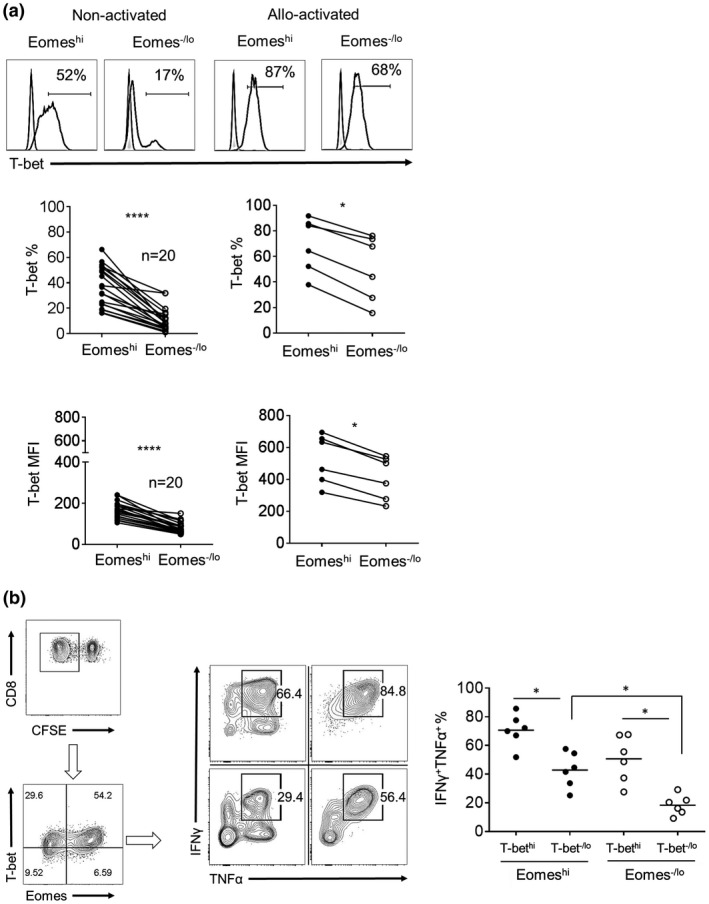
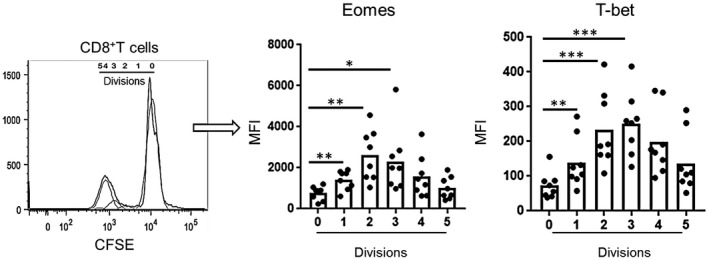
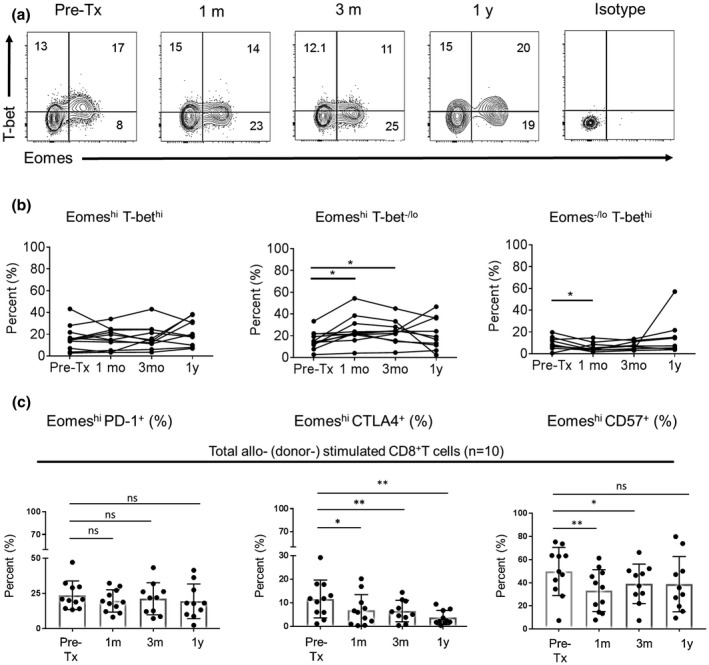
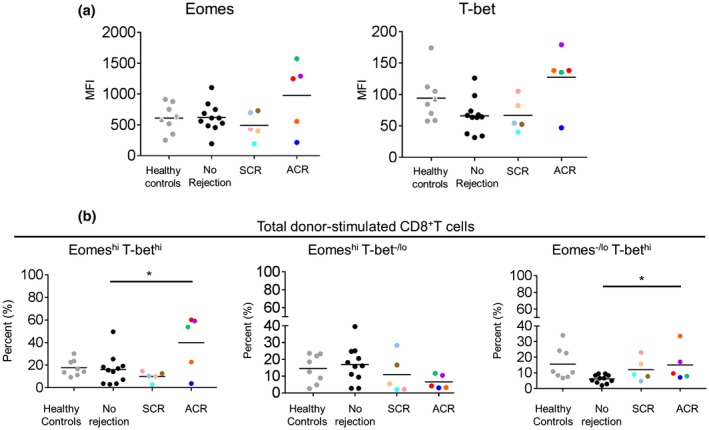
Memory T cell (Tmem) responses play a critical role in the outcome of allo-transplantation. While the role of the T-box transcription factor Eomesodermin (Eomes) in the maintenance of antigen-specific Tmem is well studied, little is known about Eomes+ CD8+ T cell responses after transplantation. We evaluated the phenotype and function of allo-reactive Eomes+ CD8+ T cells in healthy volunteers and kidney transplant patients and their relation to transplant outcome. High Eomes expression by steady-state CD8+ T cells correlated with effector and memory phenotype. Following allo-stimulation, the expression of both the T-box proteins Eomes and T-bet by proliferating cells increased significantly, where high expression of Eomes and T-bet correlated with higher incidence of allo-stimulated IFNγ+ TNFα+ CD8+ T cells. In patients with no subsequent rejection, Eomes but not T-bet expression by donor-stimulated CD8+ T cells, increased significantly after transplantation. This was characterized by increased Eomeshi T-bet-/lo and decreased Eomes-/lo T-bethi CD8+ T cell subsets, with no significant changes in the Eomeshi T-bethi CD8+ T cell subset. No upregulation of exhaustion markers programmed-death-1 (PD-1) and cytotoxic-T-lymphocyte-associated-antigen-4 (CTLA4) by donor-stimulated Eomes+ CD8+ T cells was observed. Before transplantation, in patients without rejection, there were higher incidences of Eomeshi T-bet-/lo , and lower incidences of Eomeshi T-bethi and Eomes-/lo T-bethi donor-stimulated CD8+ T cell subsets, compared to those with subsequent rejection. Overall, our findings indicate that high Eomes expression by allo-stimulated T-bet+ CD8+ T cells is associated with enhanced effector function, and that an elevated incidence of donor-stimulated CD8+ T cells co-expressing high levels of Eomes and T-bet before transplantation, may correlate with an increased incidence of acute cellular rejection.
Keywords: Eomesodermin; T-bet; human; kidney transplantation; memory T cells; rejection.
© 2018 British Society for Immunology.
Figures
Similar articles
-
Eomesodermin(lo) CTLA4(hi) Alloreactive CD8+ Memory T Cells Are Associated With Prolonged Renal Transplant Survival Induced by Regulatory Dendritic Cell Infusion in CTLA4 Immunoglobulin-Treated Nonhuman Primates.Transplantation. 2016 Jan;100(1):91-102. doi: 10.1097/tp.0000000000000871. Transplantation. 2016. PMID: 26680373 Free PMC article.
-
Endogenous antigen presentation impacts on T-box transcription factor expression and functional maturation of CD8+ T cells.Blood. 2012 Oct 18;120(16):3237-45. doi: 10.1182/blood-2012-03-420182. Epub 2012 Aug 31. Blood. 2012. PMID: 22942184
-
Effect of Cytomegalovirus (CMV) and Ageing on T-Bet and Eomes Expression on T-Cell Subsets.Int J Mol Sci. 2017 Jun 29;18(7):1391. doi: 10.3390/ijms18071391. Int J Mol Sci. 2017. PMID: 28661443 Free PMC article.
-
Regulatory roles of transcription factors T-bet and Eomes in group 1 ILCs.Int Immunopharmacol. 2024 Dec 25;143(Pt 1):113229. doi: 10.1016/j.intimp.2024.113229. Epub 2024 Oct 1. Int Immunopharmacol. 2024. PMID: 39357208 Review.
-
T-bet+ memory B cells: Generation, function, and fate.Immunol Rev. 2019 Mar;288(1):149-160. doi: 10.1111/imr.12736. Immunol Rev. 2019. PMID: 30874358 Free PMC article. Review.
Cited by
-
The detailed distribution of T cell subpopulations in immune-stable renal allograft recipients: a single center study.PeerJ. 2019 Feb 8;7:e6417. doi: 10.7717/peerj.6417. eCollection 2019. PeerJ. 2019. PMID: 30775184 Free PMC article.
-
Programmed T cell differentiation: Implications for transplantation.Cell Immunol. 2020 May;351:104099. doi: 10.1016/j.cellimm.2020.104099. Epub 2020 Mar 29. Cell Immunol. 2020. PMID: 32247511 Free PMC article. Review.
-
TCF1highPD-1+Ly108+CD8+ T Cells Are Associated with Graft Preservation in Sensitized Mice Treated with Non-Fc Receptor-Binding CD3 Antibodies.Immunohorizons. 2024 Apr 1;8(4):295-306. doi: 10.4049/immunohorizons.2300117. Immunohorizons. 2024. PMID: 38587418 Free PMC article.
-
Donor-derived regulatory dendritic cell infusion results in host cell cross-dressing and T cell subset changes in prospective living donor liver transplant recipients.Am J Transplant. 2021 Jul;21(7):2372-2386. doi: 10.1111/ajt.16393. Epub 2020 Dec 23. Am J Transplant. 2021. PMID: 33171019 Free PMC article.
-
The Entangled World of Memory T Cells and Implications in Transplantation.Transplantation. 2024 Jan 1;108(1):137-147. doi: 10.1097/TP.0000000000004647. Epub 2023 Dec 13. Transplantation. 2024. PMID: 37271872 Free PMC article. Review.
References
-
- Shiao SL, McNiff JM, Pober JS. Memory T cells and their costimulators in human allograft injury. The Journal of Immunology. 2005;175:4886–96. - PubMed
-
- Masopust D, Vezys V, Marzo AL, Lefrancois L. Preferential localization of effector memory cells in nonlymphoid tissue. Science. 2001;291:2413–7. - PubMed
-
- Lakkis FG, Sayegh MH. Memory T cells: a hurdle to immunologic tolerance. Journal of the American Society of Nephrology. 2003;14:2402–10. - PubMed
Publication types
MeSH terms
Substances
Grants and funding
LinkOut - more resources
Full Text Sources
Other Literature Sources
Medical
Research Materials
