

UBC-Nepal expedition: peripheral fatigue recovers faster in Sherpa than lowlanders at high altitude
- PMID: 30239002
- PMCID: PMC6235937
- DOI: 10.1113/JP276599
UBC-Nepal expedition: peripheral fatigue recovers faster in Sherpa than lowlanders at high altitude
Abstract
Key points: The reduced oxygen tension of high altitude compromises performance in lowlanders. In this environment, Sherpa display superior performance, but little is known on this issue. Sherpa present unique genotypic and phenotypic characteristics at the muscular level, which may enhance resistance to peripheral fatigue at high altitude compared to lowlanders. We studied the impact of gradual ascent and exposure to high altitude (5050 m) on peripheral fatigue in age-matched lowlanders and Sherpa, using intermittent electrically-evoked contractions of the knee extensors. Peripheral fatigue (force loss) was lower in Sherpa during the first part of the protocol. Post-protocol, the rate of force development and contractile impulse recovered faster in Sherpa than in lowlanders. At any time, indices of muscle oxygenation were not different between groups. Muscle contractile properties in Sherpa, independent of muscle oxygenation, were less perturbed by non-volitional fatigue. Hence, elements within the contractile machinery contribute to the superior physical performance of Sherpa at high altitude.
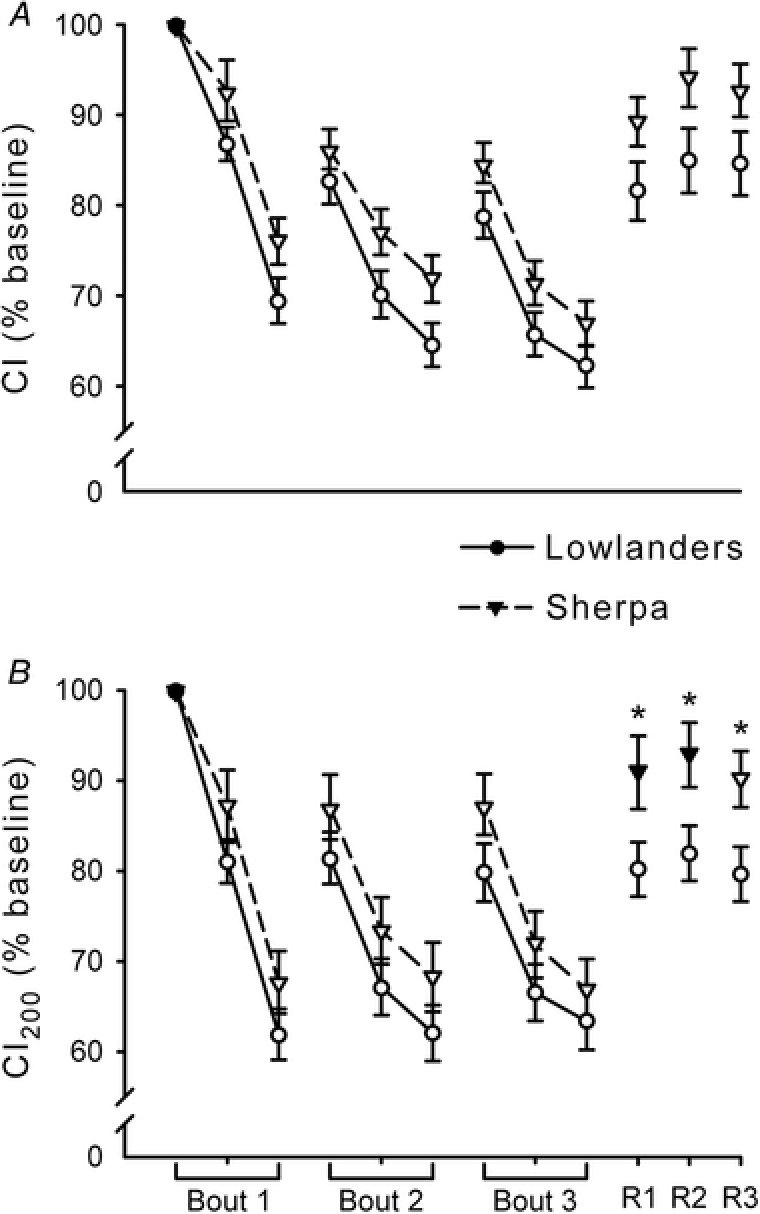
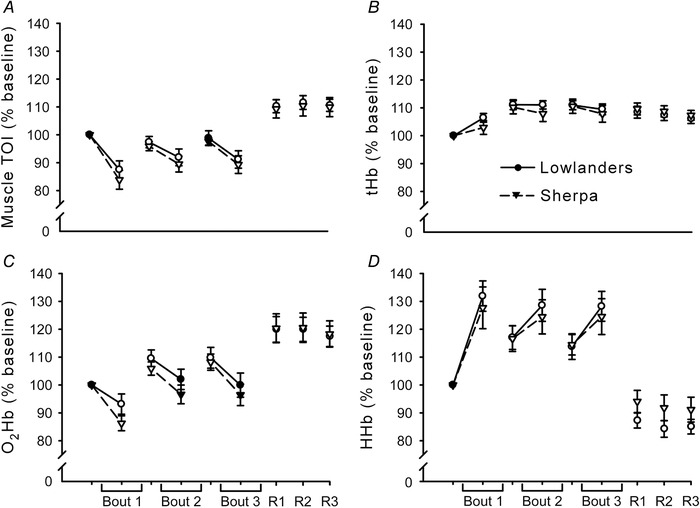
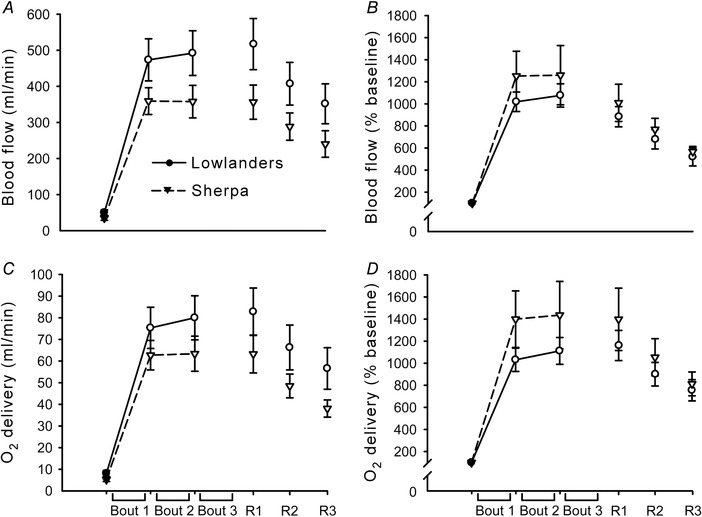
Abstract: Altitude-related acclimatisation is characterised by marked muscular adaptations. Lowlanders and Sherpa differ in their muscular genotypic and phenotypic characteristics, which may influence peripheral fatigability at altitude. After gradual ascent to 5050 m, 12 lowlanders and 10 age-matched Sherpa (32 ± 10 vs. 31 ± 11 years, respectively) underwent three bouts (separated by 15 s rest) of 75 intermittent electrically-evoked contractions (12 pulses at 15 Hz, 1.6 s between train onsets) of the dominant leg quadriceps, at the intensity which initially evoked 30% of maximal voluntary force. Trains were also delivered at minutes 1, 2 and 3 after the protocol to measure recovery. Tissue oxygenation index (TOI) and total haemoglobin (tHb) were quantified by a near-infrared spectroscopy probe secured over rectus femoris. Superficial femoral artery blood flow was recorded using ultrasonography, and delivery of oxygen was estimated (eDO2 ). At the end of bout 1, peak force was greater in Sherpa than in lowlanders (91.5% vs. 84.5% baseline, respectively; P < 0.05). Peak rate of force development (pRFD), the first 200 ms of the contractile impulse (CI200 ), and half-relaxation time (HRT) recovered faster in Sherpa than in lowlanders (percentage of baseline at 1 min: pRFD: 89% vs. 74%; CI200 : 91% vs. 80%; HRT: 113% vs. 123%, respectively; P < 0.05). Vascular measures were pooled for lowlanders and Sherpa as they did not differ during fatigue or recovery (P < 0.05). Mid bout 3, TOI was decreased (90% baseline) whereas tHb was increased (109% baseline). After bout 3, eDO2 was markedly increased (1266% baseline). The skeletal muscle of Sherpa seemingly favours repeated force production at altitude for similar oxygen delivery compared to lowlanders.
Keywords: contractile properties; electrical stimulation; hypoxia; muscle oxygenation; quadricep.
© 2018 The Authors. The Journal of Physiology © 2018 The Physiological Society.
Figures

Similar articles
-
Neuromuscular fatigability at high altitude: Lowlanders with acute and chronic exposure, and native highlanders.Acta Physiol (Oxf). 2022 Apr;234(4):e13788. doi: 10.1111/apha.13788. Epub 2022 Jan 25. Acta Physiol (Oxf). 2022. PMID: 35007386 Free PMC article. Review.
-
UBC-Nepal expedition: phenotypical evidence for evolutionary adaptation in the control of cerebral blood flow and oxygen delivery at high altitude.J Physiol. 2019 Jun;597(12):2993-3008. doi: 10.1113/JP277596. Epub 2019 May 13. J Physiol. 2019. PMID: 31026348
-
Supraspinal Fatigue and Neural-evoked Responses in Lowlanders and Sherpa at 5050 m.Med Sci Sports Exerc. 2019 Jan;51(1):183-192. doi: 10.1249/MSS.0000000000001748. Med Sci Sports Exerc. 2019. PMID: 30095744
-
High-Altitude Acclimatization Improves Recovery from Muscle Fatigue.Med Sci Sports Exerc. 2020 Jan;52(1):161-169. doi: 10.1249/MSS.0000000000002100. Med Sci Sports Exerc. 2020. PMID: 31343519
-
Short-term adaptation and chronic cardiac remodelling to high altitude in lowlander natives and Himalayan Sherpa.Exp Physiol. 2015 Nov;100(11):1242-6. doi: 10.1113/expphysiol.2014.082503. Epub 2014 Nov 20. Exp Physiol. 2015. PMID: 26575341 Review.
Cited by
-
Population History and Altitude-Related Adaptation in the Sherpa.Front Physiol. 2019 Aug 28;10:1116. doi: 10.3389/fphys.2019.01116. eCollection 2019. Front Physiol. 2019. PMID: 31555147 Free PMC article. Review.
-
Neuromuscular fatigability at high altitude: Lowlanders with acute and chronic exposure, and native highlanders.Acta Physiol (Oxf). 2022 Apr;234(4):e13788. doi: 10.1111/apha.13788. Epub 2022 Jan 25. Acta Physiol (Oxf). 2022. PMID: 35007386 Free PMC article. Review.
-
Relationship between cardiorespiratory phase coherence during hypoxia and genetic polymorphism in humans.J Physiol. 2020 May;598(10):2001-2019. doi: 10.1113/JP278829. Epub 2020 Feb 26. J Physiol. 2020. PMID: 31957891 Free PMC article.
-
Could genetic and epigenetic factors explain hypoxia tolerance and superior muscle performance of Sherpas at high-altitude?J Physiol. 2019 Mar;597(5):1231-1232. doi: 10.1113/JP277593. Epub 2019 Jan 28. J Physiol. 2019. PMID: 30632151 Free PMC article. No abstract available.
References
-
- Aagaard P, Simonsen EB, Andersen JL, Magnusson P & Dyhre‐Poulsen P (2002). Increased rate of force development and neural drive of human skeletal muscle following resistance training. J Appl Physiol 93, 1318–1326. - PubMed
-
- Aldenderfer M (2003). Moving up in the world. American Scientist 91, 542–549.
-
- Allen DG, Lamb GD & Westerblad H (2008). Skeletal muscle fatigue: cellular mechanisms. Physiol Rev 88, 287–332. - PubMed
-
- Allen PS, Matheson GO, Zhu G, Gheorgiu D, Dunlop RS, Falconer T, Stanley C & Hochachka PW (1997). Simultaneous 31P MRS of the soleus and gastrocnemius in Sherpa during graded calf muscle exercise. Am J Physiol Regul Integr Comp Physiol 273, R999–R1007. - PubMed
-
- Allman BL & Rice CL (2004). An age‐related shift in the force‐frequency relationship affects quadriceps fatigability in old adults. J Appl Physiol 96, 1026–1032. - PubMed
Publication types
MeSH terms
Grants and funding
LinkOut - more resources
Full Text Sources
Other Literature Sources
Medical