

Vascularization converts the lineage fate of bone mesenchymal stem cells to endothelial cells in tissue-engineered bone grafts by modulating FGF2-RhoA/ROCK signaling
- PMID: 30237398
- PMCID: PMC6147920
- DOI: 10.1038/s41419-018-0999-6
Vascularization converts the lineage fate of bone mesenchymal stem cells to endothelial cells in tissue-engineered bone grafts by modulating FGF2-RhoA/ROCK signaling
Abstract
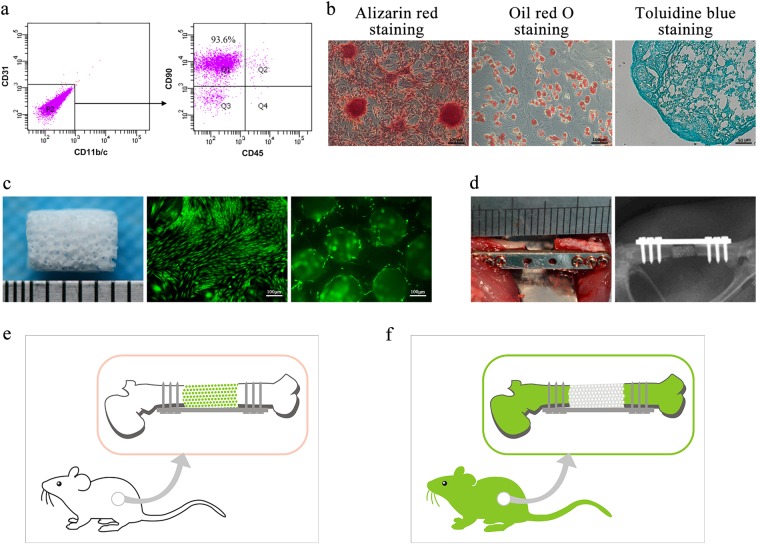
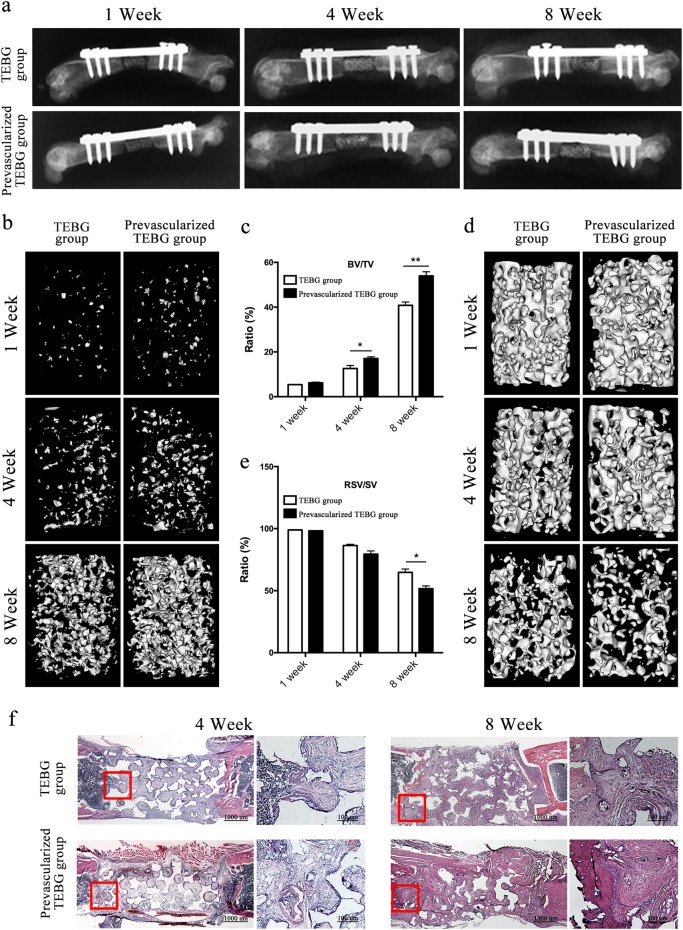
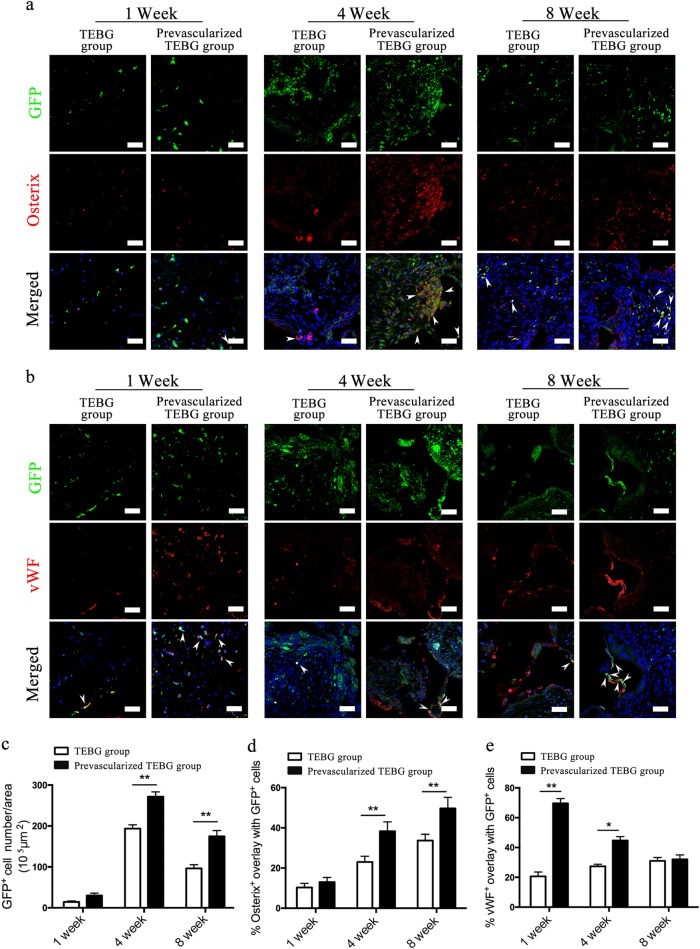
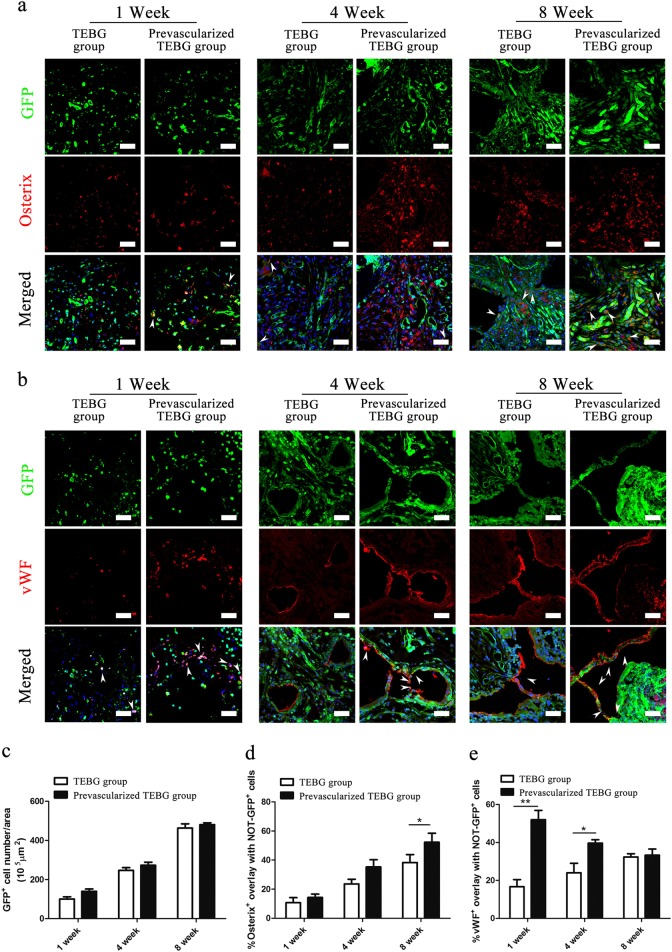
The prevascularization of tissue-engineered bone grafts (TEBGs) has been shown to accelerate capillary vessel ingrowth in bone defect remodeling and to enhance new bone formation. However, the exact mechanisms behind this positive effect remain unknown. Here, we report that basic fibroblast growth factor (FGF2)-Ras homolog gene family member A (RhoA)/Rho-associated protein kinase (ROCK) signaling functions as a molecular switch to regulate the lineage fate of bone mesenchymal stem cells (BMSCs) and that prevascularization promotes the cell fate switch, which contributes to increased bone regeneration with the use of prevascularized TEBGs compared with control TEBGs. Prevascularized TEBGs enhanced the in vivo endothelial differentiation of BMSCs by inhibiting RhoA/ROCK signaling. In vitro data more clearly showed that BMSCs differentiated into von Willebrand factor (vWF)-positive endothelial cells, and FGF2-induced inhibition of RhoA/ROCK signaling played a key role. Our novel findings uncovered a new mechanism that stimulates the increased vascularization of engineered bone and enhanced regeneration by promoting the endothelial differentiation of BMSCs implanted in TEBGs. These results offer a new molecular target to regulate TEBG-induced bone regeneration.
Conflict of interest statement
The authors declare that they have no conflict of interest.
Figures


Similar articles
-
Ras homolog family member A/Rho-associated protein kinase 1 signaling modulates lineage commitment of mesenchymal stem cells in asthmatic patients through lymphoid enhancer-binding factor 1.J Allergy Clin Immunol. 2019 Apr;143(4):1560-1574.e6. doi: 10.1016/j.jaci.2018.08.023. Epub 2018 Sep 5. J Allergy Clin Immunol. 2019. PMID: 30194990 Free PMC article.
-
Schwann cells promote prevascularization and osteogenesis of tissue-engineered bone via bone marrow mesenchymal stem cell-derived endothelial cells.Stem Cell Res Ther. 2021 Jul 7;12(1):382. doi: 10.1186/s13287-021-02433-3. Stem Cell Res Ther. 2021. PMID: 34233721 Free PMC article.
-
RhoA determines lineage fate of mesenchymal stem cells by modulating CTGF-VEGF complex in extracellular matrix.Nat Commun. 2016 Apr 29;7:11455. doi: 10.1038/ncomms11455. Nat Commun. 2016. PMID: 27126736 Free PMC article.
-
Functions of Rho family of small GTPases and Rho-associated coiled-coil kinases in bone cells during differentiation and mineralization.Biochim Biophys Acta Gen Subj. 2017 May;1861(5 Pt A):1009-1023. doi: 10.1016/j.bbagen.2017.02.005. Epub 2017 Feb 8. Biochim Biophys Acta Gen Subj. 2017. PMID: 28188861 Review.
-
Pathophysiological effects of RhoA and Rho-associated kinase on cardiovascular system.J Hypertens. 2016 Jan;34(1):3-10. doi: 10.1097/HJH.0000000000000768. J Hypertens. 2016. PMID: 26556565 Review.
Cited by
-
Substantial Overview on Mesenchymal Stem Cell Biological and Physical Properties as an Opportunity in Translational Medicine.Int J Mol Sci. 2019 Oct 29;20(21):5386. doi: 10.3390/ijms20215386. Int J Mol Sci. 2019. PMID: 31671788 Free PMC article. Review.
-
Nidogen1-enriched extracellular vesicles accelerate angiogenesis and bone regeneration by targeting Myosin-10 to regulate endothelial cell adhesion.Bioact Mater. 2021 Oct 27;12:185-197. doi: 10.1016/j.bioactmat.2021.10.021. eCollection 2022 Jun. Bioact Mater. 2021. PMID: 35310379 Free PMC article.
-
Synthesis of scaffold-free, three dimensional, osteogenic constructs following culture of skeletal osteoprogenitor cells on glass surfaces.Bone Rep. 2021 Oct 18;15:101143. doi: 10.1016/j.bonr.2021.101143. eCollection 2021 Dec. Bone Rep. 2021. PMID: 34746337 Free PMC article.
-
Motivating role of type H vessels in bone regeneration.Cell Prolif. 2020 Sep;53(9):e12874. doi: 10.1111/cpr.12874. Epub 2020 Jul 19. Cell Prolif. 2020. PMID: 33448495 Free PMC article. Review.
-
An injectable pH neutral bioactive glass-based bone cement with suitable bone regeneration ability.J Orthop Translat. 2022 Sep 2;36:120-131. doi: 10.1016/j.jot.2022.05.011. eCollection 2022 Sep. J Orthop Translat. 2022. PMID: 36128442 Free PMC article.
References
-
- Lewandrowski KU, Gresser JD, Wise DL, Trantol DJ. Bioresorbable bone graft substitutes of different osteoconductivities: a histologic evaluation of osteointegration of poly(propylene glycol-co-fumaric acid)-based cement implants in rats. Biomaterials. 2000;21:757–764. doi: 10.1016/S0142-9612(99)00179-9. - DOI - PubMed
-
- Long W, Einhorn TA, Koval K, Mckee M, Smith W. Bone grafts and bone graft substitutes in orthopaedic trauma surgery. J. Bone. 2007;89:649–658. - PubMed
Publication types
MeSH terms
Substances
LinkOut - more resources
Full Text Sources
Other Literature Sources
Miscellaneous
