. 2018 Jul 30;7(9):e1468951.
doi: 10.1080/2162402X.2018.1468951. eCollection 2018.

Losses of cytokines and chemokines are common genetic features of human cancers: the somatic copy number alterations are correlated with patient prognoses and therapeutic resistance

Affiliations

Losses of cytokines and chemokines are common genetic features of human cancers: the somatic copy number alterations are correlated with patient prognoses and therapeutic resistance

Henry Sung-Ching Wong et al. Oncoimmunology. .

Abstract

Intricate relationships among cytokines (including chemokines) shape the tumor microenvironment (TME) and reflect cell-cell interactions between malignant cells and other cells from the TME. Although our previous study indicated the transcriptional landscape of cytokines in 19 cancer types, the global pattern somatic copy number (SCN) alterations and the clinical relevance of cytokines have not been systematically investigated. Here, we reported a significant negative selection on cytokine genes. We also linked the SCN losses of cytokine genes to the abundance of immune infiltrates which affects cancer progression and patient prognoses. We also demonstrated and validated the correlations between SCN alterations of cytokine-containing loci and drug sensitivity. The results indicated the genomic loss of cytokines in malignant cells as a crucial theme for interrogating cancer progression, malignant cell-TME interactions, and therapeutics.

Keywords: cancer genetic landscape; chemokines; cytokines; pan-cancer bioinformatics analysis; somatic copy number (SCN) alterations.


Figures

Figure 1.
Figure 1.
Cytokine copy numbers are somatically altered in human cancers. (A) Heatmap showing the fraction of somatic copy number (SCN) alterations of cytokine-containing loci (y axis) across 19 cancer types (x axis). Cytokines were ordered according to their genomic coordination. For each cancer type, red and blue colors respectively indicate percentages of SCN gain and loss events across specimens of corresponding genomic coordination. Numbers at the top are average percentages of SCN gain and loss values across cytokines. (B) Distributions of SCN gain (x axis) and loss (y axis) fractions of cytokines in each cancer type. Each dot represents the frequency of a cytokine gene in a specific cancer type. For each cancer type, cytokines with a fraction of SCN gain or loss of > 0.25 (high-frequency) are respectively denoted in red and blue. Cytokines with both fractions of SCN gain and loss of > 0.25 or < 0.25 are respectively denoted in black and gray. (C) Distribution of SCN gain and loss fractions of other protein-coding genes (PCGs) in each cancer type.
Figure 2.
Figure 2.
Sharing patterns of high-frequency somatic copy number (SCN) alterations of cytokines across cancers. (A) Pie chart showing the distribution of sharing patterns of high-frequency SCN gain of cytokines. The number outside the parentheses indicates the number of shared cancer types. The number and percentage of cytokines are indicated inside the parentheses. (B) Pie charts showing distributions of shared patterns of high-frequency SCN loss of cytokines. (C) Distribution of number of (high-frequency) amplified cytokines (x axis) and the number of shared cancer types (y axis). noCytokines (high-frequency amplified in none of the cancer types), spCytokines (shared across one or two cancer types), and coCytokines (shared in ≥ 3 cancer types) are separated by two dotted lines. (D) Distribution of the number of (high-frequency) deleted cytokines and number of shared cancer types. (E) The number of high-frequency SCN loss events in each cytokine family. Bars are colored on the basis of cytokine categories (spCytokines, noCytokines, and coCytokines) (F) The percentage of high-frequency SCN loss events in each cytokine family.
Figure 3.
Figure 3.
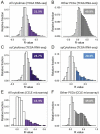
Transcript abundances of cytokines are less explained by somatic copy number (SCN) alterations. (A) Histogram showing frequency distributions of cytokines’ SCN-RNA correlation coefficients in all cancer types from TCGA. Percentages of cytokines with an SCN-RNA correlation coefficient of > 0.2 are shown and highlighted in color. (B) Histogram showing frequency distributions of other protein-coding genes (PCGs)’ SCN-RNA correlation coefficients in all cancer types from TCGA. (C) Histogram showing frequency distributions of coCytokines’ SCN-RNA correlation coefficients in all cancer types from TCGA. (D) Histogram showing frequency distributions of spCytokines’ SCN-RNA correlation coefficients in all cancer types from TCGA. (E) Histogram showing frequency distributions of cytokines’ SCN-RNA correlation coefficients in all cancer types from the CCLE. (F) Histogram showing frequency distributions of the other PCGs’ SCN-RNA correlation coefficients in all cancer types from the CCLE. The area of color in the histogram is approximate to the percentage of the number of genes with SCN-RNA correlation coefficients of > 0.2.
Figure 4.
Figure 4.
Deconvolution of bulk cancer mRNA profiles suggests a positive correlation between the somatic copy number (SCN) of coCytokines and immune infiltrates. (A) The correlation coefficient (x axis) between SCNs of cytokines and immune metagenes (adopted from Bindea et al.) across cytokine categories (coCytokines vs. noCytokines vs. spCytokines). (B) Correlation coefficients of cytokine categories (x axis) and each immune metagene (y axis). Hierarchical clustering was performed on immune cell types to depict their similarity of correlations to cytokine categories. (C) Validation, correlation coefficient (x axis) between the SCNs of cytokines and immune metagenes (derived from single-cell profiles, I. Tirosh et al.) across cytokine categories.
Figure 5.
Figure 5.
Clinical relevance of cytokine categories. (A) Distributions of mean somatic copy number (SCN) levels of coCytokines (y axis) across different pathological stages. (B) Comparison of the mean fraction of coCytokine and spCytokine SCN losses (y axis) and pathological stages (x axis). For each pathological stage, average fractions (across cancer types) of high-frequency (> 25% across specimens) SCN loss were calculated. The red star denotes a significant difference (p < 0.05). (C) The number of cytokines that are significantly associated with patients’ overall survival (FDR < 0.1) in each cancer type. Numbers of significant cytokines are shown. Bars are colored on the basis of the direction of the effect, i.e., orange for protection (hazard ratio (HR) < 1) and green for damaging (HR > 1). (D) Percentages of protection and damaging effects of cytokine categories. The percentages were calculated from cytokines that were significantly associated with overall survival (FDR < 0.1).
Figure 6.
Figure 6.
Therapeutic liability of somatic copy number (SCN) alterations of cytokines in human cancers with using the Cancer Cell Line Encyclopedia (CCLE) database. (A) Heat map showing correlations of SCN levels of cytokines (including coCytokines, noCytokines and spCytokines, row) and 50% inhibitory concentration (IC50) values of 24 drugs (column). Each cell represents the Pearson’s product moment correlation coefficient. (B) Percentages of positive and negative correlations of cytokine categories to IC50 values of 24 drugs. Ratios were calculated from significant cytokines in each cancer type. Bars are colored on the basis of the direction of the effect, i.e., orange for positive correlations (r > 0) and green for negative correlations (r < 0). (C) Numbers of cytokines that were significantly correlated with drug sensitivity (false discovery rate [FDR]-adjusted). Bars are colored on the basis of cytokine categories. (D) Validation, average log multiple of change (FC) of 16 coCytokines (associated with the IC50 of lapatinib) in four conditions (y axis). (E) Validation, logFC of five (out of 18) coCytokines differentially expressed in dovitinib (TKI258)-treated LC-2/ad DR compared to dovitinib-treated LC2/ad cells. logFC, estimated logFC corresponding to dovitinib-treated LC-2/ad DR vs. dovitinib-treated LC2/ad cells; AveExpr, average expression across all samples; T, moderated t-statistic; PAdjusted, Benjamini and Hochberg (BH)-adjusted p value; B, log odds.

Similar articles

Cited by

References

    1. Beroukhim R, Mermel CH, Porter D, Wei G, Raychaudhuri S, Donovan J, Barretina J, Boehm JS, Dobson J, Urashima M, et al. The landscape of somatic copy-number alteration across human cancers. Nature. 2010;463:899–905. doi:10.1038/nature08822. - DOI - PMC - PubMed
    1. Stratton MR, Campbell PJ, Futreal PA.. The cancer genome. Nature. 2009;458:719–724. doi:10.1038/nature07943. - DOI - PMC - PubMed
    1. Zack TI, Schumacher SE, Carter SL, Cherniack AD, Saksena G, Tabak B, Lawrence MS, Zhsng CZ, Wala J, Mermel CH, et al. Pan-cancer patterns of somatic copy number alteration. Nat Genet. 2013;45:1134–1140. doi:10.1038/ng.2760. - DOI - PMC - PubMed
    1. Kim TM, Xi R, Luquette LJ, Park RW, Johnson MD, Park PJ. Functional genomic analysis of chromosomal aberrations in a compendium of 8000 cancer genomes. Genome Res. 2013;23:217–227. doi:10.1101/gr.140301.112. - DOI - PMC - PubMed
    1. Mbeunkui F, Johann DJ Jr.. Cancer and the tumor microenvironment: a review of an essential relationship. Cancer Chemother Pharmacol. 2009;63:571–582. doi:10.1007/s00280-008-0881-9. - DOI - PMC - PubMed

Publication types

Grants and funding

This work was supported by grants from The Featured Areas Research Center Program within the framework of the Higher Education Sprout Project by the Ministry of Education (DP2-107-20000), from the Ministry of Science and Technology (MOST 105-2628-B- 038 ∑001 -MY4) and from Taipei Medical University (12310-0223), National Health Research Institutes (NHRI-107A1-MGCP-1817202).

LinkOut - more resources