. 2018 Sep 11;3(5):e00057-18.
doi: 10.1128/mSystems.00057-18. eCollection 2018 Sep-Oct.

Coordinated Hibernation of Transcriptional and Translational Apparatus during Growth Transition of Escherichia coli to Stationary Phase

Affiliations

Coordinated Hibernation of Transcriptional and Translational Apparatus during Growth Transition of Escherichia coli to Stationary Phase

Hideji Yoshida et al. mSystems. .

Abstract

In the process of Escherichia coli K-12 growth from exponential phase to stationary, marked alteration takes place in the pattern of overall genome expression through modulation of both parts of the transcriptional and translational apparatus. In transcription, the sigma subunit with promoter recognition properties is replaced from the growth-related factor RpoD by the stationary-phase-specific factor RpoS. The unused RpoD is stored by binding with the anti-sigma factor Rsd. In translation, the functional 70S ribosome is converted to inactive 100S dimers through binding with the ribosome modulation factor (RMF). Up to the present time, the regulatory mechanisms of expression of these two critical proteins, Rsd and RMF, have remained totally unsolved. In this study, attempts were made to identify the whole set of transcription factors involved in transcription regulation of the rsd and rmf genes using the newly developed promoter-specific transcription factor (PS-TF) screening system. In the first screening, 74 candidate TFs with binding activity to both of the rsd and rmf promoters were selected from a total of 194 purified TFs. After 6 cycles of screening, we selected 5 stress response TFs, ArcA, McbR, RcdA, SdiA, and SlyA, for detailed analysis in vitro and in vivo of their regulatory roles. Results indicated that both rsd and rmf promoters are repressed by ArcA and activated by McbR, RcdA, SdiA, and SlyA. We propose the involvement of a number of TFs in simultaneous and coordinated regulation of the transcriptional and translational apparatus. By using genomic SELEX (gSELEX) screening, each of the five TFs was found to regulate not only the rsd and rmf genes but also a variety of genes for growth and survival. IMPORTANCE During the growth transition of E. coli from exponential phase to stationary, the genome expression pattern is altered markedly. For this alteration, the transcription apparatus is altered by binding of anti-sigma factor Rsd to the RpoD sigma factor for sigma factor replacement, while the translation machinery is modulated by binding of RMF to 70S ribosome to form inactive ribosome dimer. Using the PS-TF screening system, a number of TFs were found to bind to both the rsd and rmf promoters, of which the regulatory roles of 5 representative TFs (one repressor ArcA and the four activators McbR, RcdA, SdiA, and SlyA) were analyzed in detail. The results altogether indicated the involvement of a common set of TFs, each sensing a specific environmental condition, in coordinated hibernation of the transcriptional and translational apparatus for adaptation and survival under stress conditions.

Keywords: Escherichia coli; PS-TF screening; anti-sigma factor Rsd; ribosome modulation factor RMF; stationary-phase adaptation.


Figures

FIG 1
FIG 1
Mapping of TF-binding sites on the rsd and rmf promoters. (A1 and B1) Location of the probes used for mapping of the binding sites of 5 TFs (ArcA, McbR, RcdA, SdiA, and SlyA). The full-size probe of the rsd promoter (A1) corresponds to 300-bp-long sequence upstream from the initiation codon of the rsd gene, while the full-size probe of the rmf promoter (B1) corresponds to the 256-bp-long spacer sequence between the pqiC and rmf genes. The location of the RpoD promoter is shown by an upward arrow with the distance (in parentheses) from the translation initiation site. The full-size rsd probe was further divided into 5 segments, while the rmf probe was divided into 4 segments. In each segment, 5′-proximal and 3′-proximal segments were designated L and R, respectively. (A2 and B2). Using all of these probes, gel shift assays were performed for mapping of the binding sites of 5 TFs on the rsd (A2) and rmf (B2) probes. A mixture of 0.5 pmol each of FITC-labeled probes was incubated with 20 pmol of each TF and directly subjected to PAGE analysis. (A3 and B3) The binding regions of TFs on the rsd (A3) and rmf (B3) promoters were elicited from the results of gel shift assays.
FIG 2
FIG 2
PS-TF screening of TFs with binding activity to the rsd and rmf promoters. Three FITC-labeled DNA probes (0.5 pmol each of 300-bp-long rsd promoter, 256-bp-long rmf promoter, and 193-bp-long internal reference DNA) were mixed with 20 pmol each of 194 species of purified TFs (listed in Table S1) in 10 μl of DNA-binding buffer, and after incubation at 37°C for 20 min, the DNA-protein mixtures were directly subjected to PAGE for detection of DNA-protein complexes under the standard running conditions (38). TFs with binding activity to the rsd probe alone, the rmf probe alone, and both of the rsd and rmf probes are shown in green, orange, and red, respectively, while TFs that showed binding activity to not only the rsd and rmf probes but also the reference probe are shown in blue.
FIG 3
FIG 3
Summary of PS-TF screening for TFs with binding activity to both the rsd and rmf promoters. A total of 194 TFs were subjected to PS-TF screening. (The pattern of the first-cycle PAGE is shown in Fig. 2.) After four cycles of the screening, a total of 74 TFs (55 group A TFs and 19 group B TFs) were found to bind to both the rsd and rmf probes. These TFs were classified into two groups: TFs shown in red exhibited strong binding to both rsd and rmf probes, while TFs shown in pink exhibited weak or faint binding to the rsd and/or rmf promoter. A selected group of 19 stress response TFs (17 group A TFs and 2 group B TFs) with strong binding activity to both probes were further subjected to the fifth and sixth cycles of PS-TF screening, while 29 TFs that showed strong binding up to the fourth cycle were not subjected to the fourth and fifth cycles (shown in the box “29 TFs” in the bottom right corner). Taking all these results together, we identified the candidate TFs with strong binding to both the rsd and rmf probes as shown in the “Judgment” column. A set of 9 TFs showed strong binding to both probes for all six cycles of PS-TF screening (shown in the box “9 TF” included in the bottom right corner). TFs highlighted in yellow represent those analyzed in detail in this article.
FIG 4
FIG 4
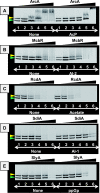
Influence of effectors on the DNA-binding activity of five TFs. A mixture of 0.5 pmol each of FITC-labeled rsd and rmf probes was incubated with increasing concentrations of TFs (lanes 1 to 6: 0, 0.5, 1, 2, 4, and 8 pmol, respectively) in the presence of 10 mM each of the following effectors: (A) AcP for ArcA, (B) AI-2 for McbR, (C) acetate for RcdA, (D) A-1 (normal HSL) for SdiA, and (E) ppGpp for SlyA.
FIG 5
FIG 5
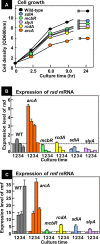
Influence of the lack of five TFs on the expression of rsd and rmf genes. (A) Wild-type and mutant strains, each defective in one of the five TF genes, were grown in medium E containing 2% polypeptone and 0.5% glucose, and growth was monitored by measuring cell density. (B) The level of rsd mRNA was measured by qRT-PCR at 2.5 (lane 1), 6.0 (lane 2), 9.0 (lane 3), and 24 (lane 4) h after inoculation of each strain. (C) The level of rmf mRNA was measured as in panel B. For both panels B and C, the level of mRNA is shown as the relative value to that at the 2.5-h culture of wild-type cells. The measurements were repeated three times, and each P value was calculated by using CT values of <0.05 for the wild-type and mutant strains.
FIG 6
FIG 6
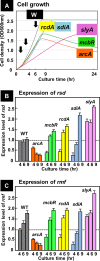
Influence of the overexpression of five TFs on the expression of rsd and rmf genes. (A) The wild type was transformed with each of five TF expression plasmids. The wild-type and transformed cells were grown in LB medium. Cell growth was monitored by measuring the cell density. At 3 h after inoculation of overnight culture into fresh medium, 50 µM IPTG was added for induction of TF expression. RNA samples were taken at 1, 3, and 6 h after induction for measurement of mRNA for each TF. (B) The level of rsd mRNA was measured by using qRT-PCR at the three growth phases indicated by arrows in panel A. (C) The level of rmf mRNA was measured as in panel B. For both panels B and C, the level of mRNA is shown as the relative value to that at the 4-h culture of wild-type cells. The measurements were repeated three times, and each P value was calculated by using CT values of <0.05 for the wild-type and mutant strains.
FIG 7
FIG 7
Influence of the lack of five TFs on the expression of Rsd protein. (A) The wild type and five mutants, each lacking the indicated gene on top, were grown in medium E containing 2% polypeptone and 0.5% glucose. Cells were harvested in the early stationary phase. The total amount of Rsd in whole-cell extract was measured by Western blotting, while the amount of affinity-purified His-tagged RpoD was measured by protein staining with Coomassie brilliant blue (CBB). The level of Rsd protein, shown in panel C, was determined by densitometry of the gel pattern and is shown as the relative value to that in wild-type cells. (B) His-tagged RpoD-Rsd complexes were affinity purified. The amount of Rsd bound on this complex was measured by immunoblotting. The total amount of His-tagged RpoD was observed by protein staining with CBB. The accuracy of immunoblot measurement by the method herein employed is more than 90% (56).
FIG 8
FIG 8
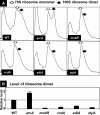
Influence of the lack of five TFs on the formation of 100S ribosome dimers. (A) The wild-type and mutants, each lacking one of the five TF genes, were grown in medium E containing 2% polypeptone and 0.5% glucose, and cells were harvested in the early stationary phase. Cell lysates were subjected to sucrose gradient centrifugation for monitoring of the ribosome patterns. Open arrows indicate 70S ribosomes, while filled arrows indicate 100S dimers. The experiments were repeated 3 times. (B) The level of 100S ribosomes was estimated by using Systat software for peak separation analysis (Systat Software, Inc., Japan). The measurements were repeated three times, and each P value was calculated by using the quantitative ratios of 70S and 100S ribosomes of <0.05 for the wild-type and mutant strains.
FIG 9
FIG 9
Genomic SELEX screening of regulatory targets of five TFs. gSELEX screening of regulatory targets was performed using each of the five purified TFs. The gSELEX pattern was analyzed by using a tiling array as described in Materials and Methods. The total number of regulatory targets was estimated by setting similar cutoff levels for all patterns. The list of possible targets for each TF is shown in Table S4.
FIG 10
FIG 10
Regulatory roles of the five stress response TFs. After PS-TF screening, a number of TFs (shown in red circles) were suggested to regulate both the rsd and rmf genes. Detailed analyses of the regulatory roles in vitro and in vivo were performed for the five representative stress response TFs (ArcA, McbR, RcdA, SdiA, and SlyA). ArcA was indicated to repress transcription of both rsd and rmf genes (shown by blue dotted arrows), while other four TFs were suggested to activate both genes (shown by red dotted arrows). gSELEX indicated that all of these TFs regulate not only the rsd and rmf genes but also a number of genes (shown in small black circles) supposedly required for survival under stressful conditions.

Similar articles

Cited by

References

    1. Kjeldgaard NO, Maaloe O, Schaechter M. 1958. The transition between different physiological states during balanced growth of Salmonella typhimurium. J Gen Microbiol 19:607–616. doi:10.1099/00221287-19-3-607. - DOI - PubMed
    1. Schaechter E, Maaloe O, Kjeldgaard NO. 1958. Dependence on medium and temperature of cell size and chemical composition during balanced growth of Salmonella typhimurium. J Gen Micribiol 19:592–606. doi:10.1099/00221287-19-3-592. - DOI - PubMed
    1. Bremer H, Dennis PP. 1996. Modulation of chemical composition and other parameters of the cell by growth rate, p 1553–1569. In Neidhardt JC, Curtiss R, III, Ingraham JL, Lin ECC, Low KB, Magasanik B, Reznikoff WS, Riley M, Schaechter M, Umbarger HE (ed), Escherichia coli and Salmonella typhimurium: cellular and molecular biology, 2nd ed, vol 2 ASM Press, Washington, DC.
    1. Keener J, Nomura M. 1996. Regulation of ribosome synthesis, p 1417–1431. In Neidhardt JC, Curtiss R, III, Ingraham JL, Lin ECC, Low KB, Magasanik B, Reznikoff WS, Riley M, Schaechter M, Umbarger HE (ed), Escherichia coli and Salmonella typhimurium: cellular and molecular biology, 2nd ed, vol 1 ASM Press, Washington, DC.
    1. Ishihama A. 1999. Modulation of the nucleoid, the transcription apparatus, and the translation machinery in bacteria for stationary phase survival. Genes Cells 4:135–143. doi:10.1046/j.1365-2443.1999.00247.x. - DOI - PubMed

LinkOut - more resources