. 2018 Sep 4;5(4):ENEURO.0061-18.2018.
doi: 10.1523/ENEURO.0061-18.2018. eCollection 2018 Jul-Aug.

Immediate-Early Promoter-Driven Transgenic Reporter System for Neuroethological Research in a Hemimetabolous Insect

Affiliations

Immediate-Early Promoter-Driven Transgenic Reporter System for Neuroethological Research in a Hemimetabolous Insect

Takayuki Watanabe et al. eNeuro. .

Abstract

Genes expressed in response to increased neuronal activity are widely used as activity markers in recent behavioral neuroscience. In the present study, we established transgenic reporter system for whole-brain activity mapping in the two-spotted cricket Gryllus bimaculatus, a hemimetabolous insect used in neuroethology and behavioral ecology. In the cricket brain, a homolog of early growth response-1 (Gryllus egr-B) was rapidly induced as an immediate-early gene (IEG) in response to neuronal hyperexcitability. The upstream genomic fragment of Gryllus egr-B contains potential binding sites for transcription factors regulated by various intracellular signaling pathways, as well as core promoter elements conserved across insect/crustacean egr-B homologs. Using the upstream genomic fragment of Gryllus egr-B, we established an IEG promoter-driven transgenic reporter system in the cricket. In the brain of transgenic crickets, the reporter gene (a nuclear-targeted destabilized EYFP) was induced in response to neuronal hyperexcitability. Inducible expression of reporter protein was detected in almost all neurons after neuronal hyperexcitability. Using our novel reporter system, we successfully detected neuronal activation evoked by feeding in the cricket brain. Our IEG promoter-driven activity reporting system allows us to visualize behaviorally relevant neural circuits at cellular resolution in the cricket brain.

Keywords: Activity mapping; Gryllus bimaculatus; immediate-early gene; transgenesis.


Figures

Figure 1.
Figure 1.
Expression of candidate neuronal IEGs in the brain of cycloheximide pretreated crickets 30 min after PTX injection. A, PTX-induced neuronal hyperexcitability in the cricket. Crickets show seizure-like behavior ∼2 min after PTX injection. 1 h before PTX/vehicle injection, 20 mM cycloheximide was injected to block de novo protein synthesis. B–G, Expression of (B) Gryllus fra total transcript, (C) fra-A isoform, (D) fra-B isoform, (E) jra, (F) egr-B, and (G) hr38 in the brains of cycloheximide pretreated crickets 30 min after injection of vehicle (5% DMSO in saline) or PTX. Expression levels of each target gene were normalized with that of Gryllus ef1α gene (Fig. 1-1). RT-qPCR analyses were performed on eight biological replicates. Box plots indicate the 25th to 75th percentile ranges and central values. Error bars indicate the 5th to 95th percentile ranges. The “+” denotes the mean. Asterisks denote statistical significance (*, p < 0.05). See Table 3 for the details of statistical analysis. See Figs. 1-2, 1-3, 1-4, and 1-5 for the structures of the encoded proteins of candidate neuronal IEGs.
Figure 2.
Figure 2.
Expression characteristics of Gryllus egr-B in the cricket brain. A, B, Expression time course of Gryllus egr-B after PTX injection in the brains of (A) cycloheximide- and (B) saline-pretreated crickets. C, Expression time course of Gryllus egr-B pre-mRNA in the brain of cycloheximide-pretreated crickets after PTX injection. D, E, Behaviorally evoked expression of Gryllus egr-B in the brain of crickets 1 h after (D) feeding of sucrose solution and (E) agonistic interaction. RT-qPCR analyses were performed on eight biological replicates. The expression levels were normalized to the mean of those of naïve animals (baseline expression level). Box plots indicate the 25th to 75th percentile ranges and central values. Error bars indicate the 5th to 95th percentile ranges. The “+” denotes the mean. Asterisks donate statistical significance to the control (0 min after PTX injection; A–C) or to the naïve animals (D, E; *, p < 0.05; **, p < 0.01; ***, p < 0.001; ****, p < 0.0001). See Table 3 for the details of statistical analysis. See Figs. 2-1, 2-2, and 1-5 for the expression characteristics of other candidate neuronal IEGs.
Figure 3.
Figure 3.
Gene regulatory regions of the insect/crustacean egr-B homologs. A, Putative core promoter regions of basal insect and crustacean egr-B homologs share a high-level sequence similarity. The upstream sequences of insect/crustacean egr-B homologs are aligned with the core promoter region of Gryllus egr-B. The conserved bases are marked with asterisks under the alignment. Cis-regulatory elements and sequence motifs that are conserved are indicated above the alignment. CRE, cAMP-responsive element; SRE, serum response element; Inr, initiator element; DPE, downstream promoter element. B, Sequence logo representation of the conserved motifs in the core promoter region of insect egr-B homologs. The sequence logo of the GAGA motif was generated by multiple alignment of the upstream sequences of polyneopteran egr-B homologs. The other sequence logos were generated by multiple alignment of the upstream sequences of insect egr-B homologs. The positions of conserved motifs are indicated by black bars under the logo. C, Schematic representation of the gene regulatory regions of insect/crustacean egr-B homologs. The genomic regions were aligned to the position of the +1 site of Gryllus egr-B or the 5′-end of the putative core promoter region. The red bars indicate genomic regions aligned in Fig. 3A. Positions of transcription factor binding sites predicted using the LASAGNA-Search 2.0 program (score >8.0) are indicated by arrowheads. The phylogenetic relationship of insect/crustacean species is indicated as a phylogram tree. AP-1, activator protein 1; CREB, cAMP response element-binding protein; C/EBP, CCAAT-enhancer-binding protein; MEF2, myocyte enhancer factor 2; NF-AT, nuclear factor of activated T-cells; SRF, serum response factor. See Table 2 for the details of genomic sequences used for promoter analysis. See Fig. 3-1 and Table 3-1 for the structural conservations of the transcription factors used for the binding site prediction.
Figure 4.
Figure 4.
Phylogenetic footprinting revealed conserved cis-regulatory modules in the upstream regions of polyneopteran egr-B homologs. A, mVISTA plot of the upstream regions of polyneopteran egr-B homologs based on MLAGAN alignment using the upstream region of Gryllus egr-B as a reference sequence. Positions of potential transcription factor binding sites in the upstream region of Gryllus egr-B are indicated by arrowheads (Fig. 3B). The horizontal and vertical axes of the plot represent the position in the sequences and the percentage identity, respectively. Two conserved cis-regulatory modules (CRMs; CRM-800 and CRM-400) and the conserved core promoter region are shaded blue and red on the plot, respectively. B, Nucleotide sequence alignments of two conserved CRMs (CRM-800 and CRM-400) found in the upstream region of polyneopteran egr-B homologs. The conserved bases are marked with asterisks under the alignment. Cis-regulatory elements conserved among most of the sequences are indicated above the alignment. Black bars under the alignments indicate sequence motifs conserved across species where no transcription factor is assigned. AP-1, binding site for activator protein 1; AP-4, binding site for activating enhancer binding protein 4; ATF2, binding site for activating transcription factor 2; CDP/Cut, binding site for CCAAT-displacement protein/cut homeobox; C/EBP, binding site for C/EBP; CRE, cAMP-responsive element; SRE, serum response element. See Table 2 for the details of genomic sequences used for promoter analysis.
Figure 5.
Figure 5.
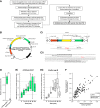
IEG promoter-driven transgenic reporter system in the cricket brain. A, Flowchart of the experimental procedures to establish the IEG reporter line. See the Materials and Methods section for detail. B, Schematic representation of the piggyBac transgenic vector for the IEG promoter-driven transgenic reporter system. The vector harbors the expression cassette of EYFPnls:PEST driven by the Gryllus egr-B promoter. 3xP3-mCherry was used as a visible selection marker. A gypsy insulator sequence (gyp) was inserted between two expression cassettes. ARE, AU-rich element; LTR, long terminal repeat. Ci, Schematic representation of the piggyBac insertion in the IEG reporter line. A 5629-bp insertion was inserted into the piggyBac donor TTAA site (highlighted in red). To conduct genotyping PCR, two primers, line19_fw and line19_rv, were designed at the 5′ and 3′ flanking region of the insertion sites, respectively. Cii, The nucleotide sequence of the genomic region flanking the piggyBac insertion in the IEG reporter line. The piggyBac donor TTAA site is highlighted in red. The positions of the annealing site of primers for genotyping PCR are indicated by white arrows under the sequence. D, Basal mRNA expressions of EYFPnls:PEST and Gryllus egr-B in the brain of naïve IEG reporter line. E, Expression time course of (Ei) EYFPnls:PEST and (Eii) Gryllus egr-B in the brain of the IEG reporter line after PTX injection. RT-qPCR analyses were performed on eight biological replicates. The expression levels were normalized to the mean of those of naïve animals (baseline expression level). Box plots indicate the 25th to 75th percentile ranges and central values. Error bars indicate the 5th to 95th percentile ranges. The “+” denotes the mean. Asterisks donate statistical significance to the control (naïve animals; *, p < 0.05; **, p < 0.01; ***, p < 0.001; ****, p < 0.0001). F, Correlation plot between the expression levels of EYFPnls:PEST and Gryllus egr-B in the brains of the IEG reporter line. The data from PTX-injected crickets (n = 75; black circles), vehicle pre-injected crickets (n = 8; gray circles), and naïve crickets (n = 8; white circles) were plotted. See Table 3 for the details of statistical analysis.
Figure 6.
Figure 6.
PTX-induced reporter protein expression in the brain of the IEG reporter line. Distribution of the reporter protein (EYFPnls:PEST) in the brain of the IEG reporter line was examined by whole-mount fluorescent immunohistochemistry. A, B, Frontal views of the supraesophageal ganglion stained with anti-GFP antibody. A, EYFP immunoreactivity was only observed in the cells is indicated by white arrowheads 6 h after vehicle injection. B, EYFP immunoreactivity was observed throughout the ganglion 6 h after PTX injection. C, D, Ventral views of the subesophageal ganglion stained with anti-GFP antibody. C, EYFP immunoreactivity was not observed 6 h after vehicle injection. D, EYFP immunoreactivity was observed throughout the ganglion 6 h after PTX injection. Dorsoventral (D-V) or rostrocaudal (R-C) axes were indicated. Scale bars represent 200 µm. See Movies 1 and 2 for the full stack of optical sections of the supraesophageal ganglia shown in A and B.
Figure 7.
Figure 7.
Sucrose feeding-evoked reporter protein expression in the DUM neurons of the IEG reporter line. A, Dorsal view of the subesophageal ganglion of the Hokudai WT strain stained with anti-Gryllus Tdc2 antibody. The outline of the ganglion is surrounded by the white dotted line. The depth of the cells is color coded as indicated in the inset. Rostrocaudal (R-C) axis was indicated. Scale bar represents 200 µm. See Fig. 7-1 for the octopamine biosynthesis pathway and the structures of the Tdc proteins in insects. See Fig. 7-2 for the frontal view of the supraesophageal ganglion and the ventral view of the subesophageal ganglion stained with anti-Gryllus Tdc2 antibody. B, Schematic drawing of the positions and numbers of the cell bodies of three DUM clusters (DUM1, DUM2, DUM3) on the dorsal side of the subesophageal ganglion. C, Double fluorescent immunostaining confirmed that the DUM neurons contain octopamine. The DUM neurons were stained with the anti-Gryllus Tdc2 antibody (green) and anti-octopamine antibody (magenta). Scale bar represents 50 µm. D, Distribution of the reporter protein (EYFPnls:PEST) in the DUM neurons of the IEG reporter line before and 6 h after feeding of sucrose solution (n = 4 each). The DUM neurons were stained with the anti-Gryllus Tdc2 antibody (green) and anti-GFP antibody (magenta). The cell bodies of Gryllus Tdc2 immunoreactive DUM neurons are surrounded by the white dotted line. The DUM neurons with nuclear EYFP immunoreactivity are indicated by white arrowheads. Scale bar represents 50 µm.

Similar articles

Cited by

References

    1. Adamo SA, Linn CE, Hoy RR (1995) The role of neurohormonal octopamine during ‘fight or flight’ behaviour in the field cricket Gryllus bimaculatus . J Exp Biol 198:1691–700. - PubMed
    1. Alaux C, Robinson GE (2007) Alarm pheromone induces immediate-early gene expression and slow behavioral response in honey bees. J Chem Ecol 33:1346–1350. 10.1007/s10886-007-9301-6 - DOI - PubMed
    1. Andersen CL, Jensen JL, Ørntoft TF (2004) Normalization of real-time quantitative reverse transcription-PCR data: a model-based variance estimation approach to identify genes suited for normalization, applied to bladder and colon cancer data sets. Cancer Res 64:5245–5250. 10.1158/0008-5472.CAN-04-0496 - DOI - PubMed
    1. Atkinson PW, Pinkerton AC, O’Brochta DA (2001) Genetic transformation systems in insects. Annu Rev Entomol 46:317–346. 10.1146/annurev.ento.46.1.317 - DOI - PubMed
    1. Barth AL (2007) Visualizing circuits and systems using transgenic reporters of neural activity. Curr Opin Neurobiol 17:567–571. 10.1016/j.conb.2007.10.003 - DOI - PMC - PubMed

Publication types

Substances

LinkOut - more resources