

GenomeFlow: a comprehensive graphical tool for modeling and analyzing 3D genome structure
- PMID: 30215673
- PMCID: PMC6477968
- DOI: 10.1093/bioinformatics/bty802
GenomeFlow: a comprehensive graphical tool for modeling and analyzing 3D genome structure
Abstract
Motivation: Three-dimensional (3D) genome organization plays important functional roles in cells. User-friendly tools for reconstructing 3D genome models from chromosomal conformation capturing data and analyzing them are needed for the study of 3D genome organization.
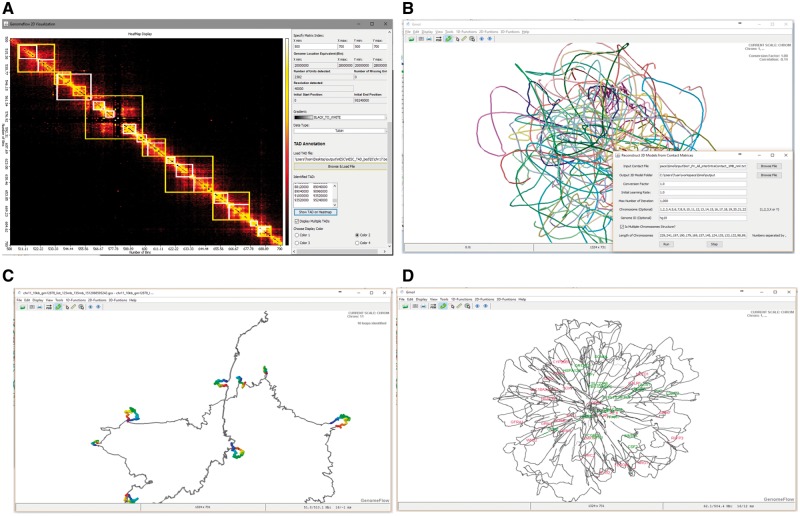
Results: We built a comprehensive graphical tool (GenomeFlow) to facilitate the entire process of modeling and analysis of 3D genome organization. This process includes the mapping of Hi-C data to one-dimensional (1D) reference genomes, the generation, normalization and visualization of two-dimensional (2D) chromosomal contact maps, the reconstruction and the visualization of the 3D models of chromosome and genome, the analysis of 3D models and the integration of these models with functional genomics data. This graphical tool is the first of its kind in reconstructing, storing, analyzing and annotating 3D genome models. It can reconstruct 3D genome models from Hi-C data and visualize them in real-time. This tool also allows users to overlay gene annotation, gene expression data and genome methylation data on top of 3D genome models.
Availability and implementation: The source code and user manual: https://github.com/jianlin-cheng/GenomeFlow.
Supplementary information: Supplementary data are available at Bioinformatics online.
© The Author(s) 2018. Published by Oxford University Press.
Figures
Similar articles
-
MOGEN: a tool for reconstructing 3D models of genomes from chromosomal conformation capturing data.Bioinformatics. 2016 May 1;32(9):1286-92. doi: 10.1093/bioinformatics/btv754. Epub 2015 Dec 31. Bioinformatics. 2016. PMID: 26722115
-
A maximum likelihood algorithm for reconstructing 3D structures of human chromosomes from chromosomal contact data.BMC Genomics. 2018 Feb 23;19(1):161. doi: 10.1186/s12864-018-4546-8. BMC Genomics. 2018. PMID: 29471801 Free PMC article.
-
Delta: a new web-based 3D genome visualization and analysis platform.Bioinformatics. 2018 Apr 15;34(8):1409-1410. doi: 10.1093/bioinformatics/btx805. Bioinformatics. 2018. PMID: 29253110
-
Techniques for and challenges in reconstructing 3D genome structures from 2D chromosome conformation capture data.Curr Opin Cell Biol. 2023 Aug;83:102209. doi: 10.1016/j.ceb.2023.102209. Epub 2023 Jul 26. Curr Opin Cell Biol. 2023. PMID: 37506571 Free PMC article. Review.
-
Chromosome structure modeling tools and their evaluation in bacteria.Brief Bioinform. 2024 Jan 22;25(2):bbae044. doi: 10.1093/bib/bbae044. Brief Bioinform. 2024. PMID: 38385874 Free PMC article. Review.
Cited by
-
A compendium and comparative epigenomics analysis of cis-regulatory elements in the pig genome.Nat Commun. 2021 Apr 13;12(1):2217. doi: 10.1038/s41467-021-22448-x. Nat Commun. 2021. PMID: 33850120 Free PMC article.
-
Remodeling of Il4-Il13-Il5 locus underlies selective gene expression.Nat Immunol. 2024 Dec;25(12):2220-2233. doi: 10.1038/s41590-024-02007-4. Epub 2024 Nov 20. Nat Immunol. 2024. PMID: 39567762
-
ParticleChromo3D: a Particle Swarm Optimization algorithm for chromosome 3D structure prediction from Hi-C data.BioData Min. 2022 Sep 21;15(1):19. doi: 10.1186/s13040-022-00305-x. BioData Min. 2022. PMID: 36131326 Free PMC article.
-
Single-cell Hi-C data enhancement with deep residual and generative adversarial networks.Bioinformatics. 2023 Aug 1;39(8):btad458. doi: 10.1093/bioinformatics/btad458. Bioinformatics. 2023. PMID: 37498561 Free PMC article.
-
3D models of fungal chromosomes to enhance visual integration of omics data.NAR Genom Bioinform. 2023 Dec 5;5(4):lqad104. doi: 10.1093/nargab/lqad104. eCollection 2023 Dec. NAR Genom Bioinform. 2023. PMID: 38058589 Free PMC article.
References
MeSH terms
LinkOut - more resources
Full Text Sources
Other Literature Sources
Molecular Biology Databases
