. 2019 Feb;38(7):1080-1092.
doi: 10.1038/s41388-018-0490-y. Epub 2018 Sep 11.

The cell cycle regulatory DREAM complex is disrupted by high expression of oncogenic B-Myb

Affiliations

The cell cycle regulatory DREAM complex is disrupted by high expression of oncogenic B-Myb

Audra N Iness et al. Oncogene. 2019 Feb.

Abstract

Overexpression of the oncogene MYBL2 (B-Myb) is associated with increased cell proliferation and serves as a marker of poor prognosis in cancer. However, the mechanism by which B-Myb alters the cell cycle is not fully understood. In proliferating cells, B-Myb interacts with the MuvB core complex including LIN9, LIN37, LIN52, RBBP4, and LIN54, forming the MMB (Myb-MuvB) complex, and promotes transcription of genes required for mitosis. Alternatively, the MuvB core interacts with Rb-like protein p130 and E2F4-DP1 to form the DREAM complex that mediates global repression of cell cycle genes in G0/G1, including a subset of MMB target genes. Here, we show that overexpression of B-Myb disrupts the DREAM complex in human cells, and this activity depends on the intact MuvB-binding domain in B-Myb. Furthermore, we found that B-Myb regulates the protein expression levels of the MuvB core subunit LIN52, a key adapter for assembly of both the DREAM and MMB complexes, by a mechanism that requires S28 phosphorylation site in LIN52. Given that high expression of B-Myb correlates with global loss of repression of DREAM target genes in breast and ovarian cancer, our findings offer mechanistic insights for aggressiveness of cancers with MYBL2 amplification, and establish the rationale for targeting B-Myb to restore cell cycle control.


Conflict of interest statement

Conflicts of Interest

The authors have no conflicts of interest to disclose.

Figures

Figure 1.
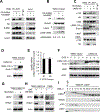
Figure 1.. Effect of B-Myb overexpression in BJ-hTERT cells.
(A) Schema of the DREAM (repressor) and MMB (activator) complexes that use a common MuvB core (pentagons) to regulate both unique and shared target genes (Venn diagram) , , . (B) Increased proliferation of BJ-hTERT cell line expressing HA-B-Myb compared to HA-GFP (control). Graph shows average increase (N=3) of cell density on day 5 relative to day 3 after plating, to account for differences in plating efficiency between the cell lines (* - p<0.05). (C) IP/WB analysis of DREAM and MMB complexes in BJ-hTERT fibroblasts stably expressing HA-GFP (control) or HA-B-Myb. Where indicated, cells were incubated without serum for 48h to promote DREAM complex formation. (D) Quantification of 1C. Relative abundance of p130 to LIN37 in B-Myb overexpressing cells was compared to that in the HA-GFP control cells (taken as 1). Graph shows average ± stdev of four independent experiments (** - p<0.01). (E) IP/WB analysis of BJ-hTERT cell lines stably expressing HA-tagged GFP control, WT B-Myb, or MuvB-binding deficient mutant (MBD) B-Myb. pS28/LIN52 ratio shows changes in pS28-LIN52 band density relative to the total LIN52 (both forms combined). Solid black arrow indicates pS28-LIN52 band here and throughout remaining figures. Vinculin blot is shown to confirm equal loading. (F) IP/WB analysis for DREAM/MMB assembly in BJ-hTERT cells stably expressing HA-GFP (control), HA-tagged WT or MuvB-binding deficient mutant (MBD) B-Myb.
Figure 2.
Figure 2.. Effects of B-Myb and LIN52 overexpression in T98G cells reveal regulation at the protein level.
(A) IP/WB analysis of parental T98G cells compared with those stably expressing HA-tagged WT or MuvB-binding deficient mutant (MBD) B-Myb. (B) WB using extracts from the cells in A showing changes in LIN52 protein and relative abundance of pS28-LIN52. (C) IP/WB analysis of T98G cells stably expressing LIN52-V5, HA-B-Myb, or both, compared with control parental cells. Open arrow indicates position of the indicated proteins here and throughout the following figures. (D) WB analysis shows downregulation of endogenous LIN52 in T98G cells stably expressing LIN52-V5. (E) RT-qPCR analysis with primers specific to endogenous LIN52 mRNA reveals no significant changes in the presence of ectopic LIN52. Graph shows average ± stdev (N=3, p>0.05). (F) WB analysis of cycloheximide (CHX) chase experiment using T98G stable cell lines expressing empty vector or LIN52-V5. (G) WB analysis of T98G cells stably expressing LIN52-V5 alone, or together with HA-B-Myb shows that B-Myb overexpression causes upregulation of the ectopically expressed LIN52. (H) Same as G, only after transient knockdown of B-Myb using siRNA. siNT, non-targeting siRNA control. (I) WB analysis of indicated proteins co-immunoprecipitated with LIN37 during cell cycle re-entry in T98G cells. Cells were synchronized in G0/G1 by serum starvation, released by adding 15% serum, and collected at different time points.
Figure 3.
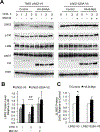
Figure 3.. B-Myb overexpression in T98G cells stabilizes LIN52 but not S28A-LIN52 mutant.
(A) Representative immunoblots show CHX chase assays using T98G cells stably expressing LIN52-V5 or LIN52-S28A-V5 proteins alone, or together with HA-B-Myb. (B, C) Quantitative analysis of LIN52-V5 and LIN52-S28A-V5 CHX chase assays shown in 3A. In panel B, graph represents average ± stdev (N=5) of LIN52 LIN52-S28A band density in control cells without B-Myb overexpression. LIN52 band density was first normalized to actin and then plotted relative to 0h (** - p<0.01). In panel C, graph shows the average change in LIN52 band density at 3h compared to 0h, in the presence of HA-B-Myb relative to that in the control cells. Note that LIN52-V5 stability in the presence of HA-B-Myb is significantly greater than in cells expressing LIN52-V5 alone (N=3, * - p<0.05) whereas LIN52-S28A-V5 is not significantly affected by HA-B-Myb.
Figure 4.
Figure 4.. Depletion of B-Myb in T98G cells increases turnover of LIN52 but not the S28A-LIN52 mutant.
(A) Representative immunoblots show that RNAi knockdown of B-Myb decreases stability of wild type LIN52, but not LIN52-S28A-V5. T98G cells stably expressing LIN52 proteins were transfected with siNT (non-targeting) or B-Myb-specific siRNA, and used for CHX chase assays after 36 hours. Note the relative stability of LIN9 and LIN37 compared with that of LIN52. Asterisk indicates non-specific band. (B) Graph shows average change in LIN52 band density at 3h compared to 0h, in siB-Myb transfected cells relative to that in siNT cells. Note that LIN52-V5 stability in the presence of siB-Myb is significantly lower than in siNT-transfected cells (N=3, * - p<0.05) whereas LIN52-S28A-V5 is not significantly affected.
Figure 5.
Figure 5.. Phosphorylation of LIN52 by DYRK1A at S28 regulates its stability.
(A) In vitro kinase assay showing LIN52 phosphorylation at S28 by DYRK1A kinase in control T98G cells, but not in the DYRK1A-KO cells. GST-LIN52 was incubated with cell extracts in the presence of ATP as indicated. Presence of LIN52 phosphorylation at S28 as well as the total GST-LIN52 and DYRK1A, was assessed by WB. Asterisk denotes non-specific band. (B) WB analysis of the endogenous LIN52 and pS28-LIN52 in control T98G cells, DYRK1A knockout (KO) cells, or cells after harmine inhibition of DYRK1A kinase activity. (C, D) CHX chase assays show that endogenous LIN52 protein is more stable in DYRK1A-KO cells or in harmine-treated cells, as compared to control. (E) RT-qPCR analysis reveals a modest increase in LIN52 mRNA expression when DYRK1A is inhibited, as compared to control cells. Graph shows average ± stdev (N=3, * and ** correspond to p-value <0.05 and <0.01, respectively).
Figure 6.
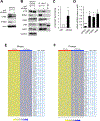
Figure 6.. Effect of B-Myb on the DREAM complex function in cancer cells.
(A) WB analysis of the extracts from siRNA-transfected SKOV3 cells shows decreased expression of LIN52 in B-Myb-depleted cells compared to control. (B) IP/WB analysis shows increased binding of p130 to LIN37 (indicative of DREAM formation) in SKOV3 cells transfected with B-Myb-specific siRNA compared to control cells. (D) Quantification of 6B. Relative abundance of p130 to LIN37 in siB-Myb transfected cells was compared to that in the siNT treated control cells (taken as 1). Graph shows average ± stdev of three independent experiments (* - p<0.05). (D) RT-qPCR analysis shows decreased expression of FOXM1 (DREAM target) and CCNB2 (DREAM and MMB target) genes upon B-Myb knockdown in SKOV3 cells. Graph shows average ± stdev of three independent experiments (* - p<0.05). (E, F) DREAM and MMB target genes are significantly upregulated in breast and ovarian cancers with high B-Myb expression (Fisher’s exact test p-values 1.2−102 and 0.0065, respectively). Top 50 up-regulated genes in TCGA gene expression dataset of breast and ovarian cancer tumors with high expression of B-Myb are shown (χ with Yates correction p<0.001). Genes were annotated as DREAM or MMB targets using http://www.targetgenereg.org .
Figure 7:
Figure 7:. Model of opposing regulation of DREAM by B-Myb and DYRK1A.
High expression of B-Myb or inhibition of DYRK1A can interfere with DREAM assembly by promoting accumulation of un-phosphorylated LIN52, resulting in deregulation of cell cycle expression in cancer.

Similar articles

Cited by

References

    1. Allegra CJ, Aberle DR, Ganschow P, Hahn SM, Lee CN, Millon-Underwood S et al. National Institutes of Health State-of-the-Science Conference statement: Diagnosis and Management of Ductal Carcinoma In Situ September 22–24, 2009. Journal of the National Cancer Institute 2010; 102: 161–169. - PubMed
    1. Barretina J, Caponigro G, Stransky N, Venkatesan K, Margolin AA, Kim S et al. The Cancer Cell Line Encyclopedia enables predictive modelling of anticancer drug sensitivity. Nature 2012; 483: 603–607. - PMC - PubMed
    1. Becker W, Sippl W. Activation, regulation, and inhibition of DYRK1 A. The FEBS journal 2011; 278: 246–256. - PubMed
    1. Chen X, Muller GA, Quaas M, Fischer M, Han N, Stutchbury B et al. The forkhead transcription factor FOXM1 controls cell cycle-dependent gene expression through an atypical chromatin binding mechanism. Mol Cell Biol 2012; 33: 227–236. - PMC - PubMed
    1. Dedic Plavetic N, Jakic-Razumovic J, Kulic A, Vrbanec D. Prognostic value of proliferation markers expression in breast cancer. Medical oncology 2013; 30: 523. - PubMed

Publication types

MeSH terms