

Translating SOD1 Gene Silencing toward the Clinic: A Highly Efficacious, Off-Target-free, and Biomarker-Supported Strategy for fALS
- PMID: 30195799
- PMCID: PMC6023790
- DOI: 10.1016/j.omtn.2018.04.015
Translating SOD1 Gene Silencing toward the Clinic: A Highly Efficacious, Off-Target-free, and Biomarker-Supported Strategy for fALS
Abstract
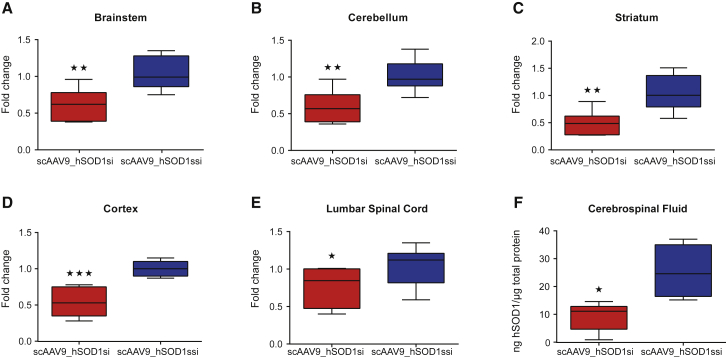
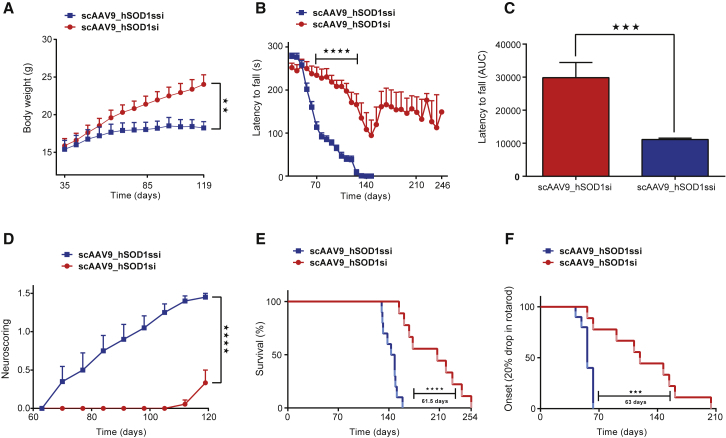
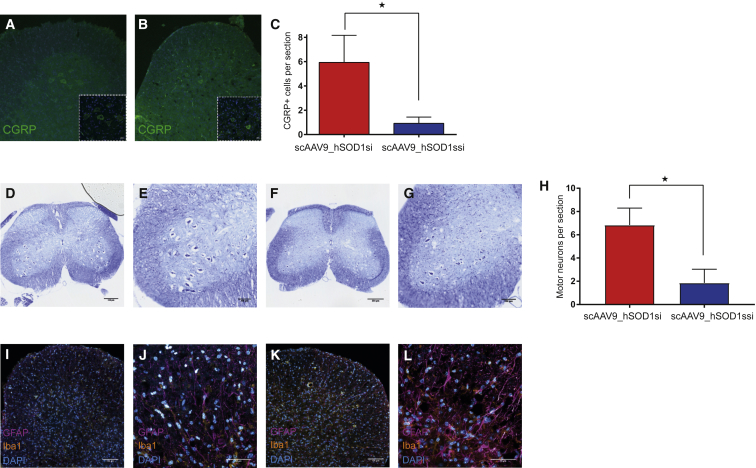
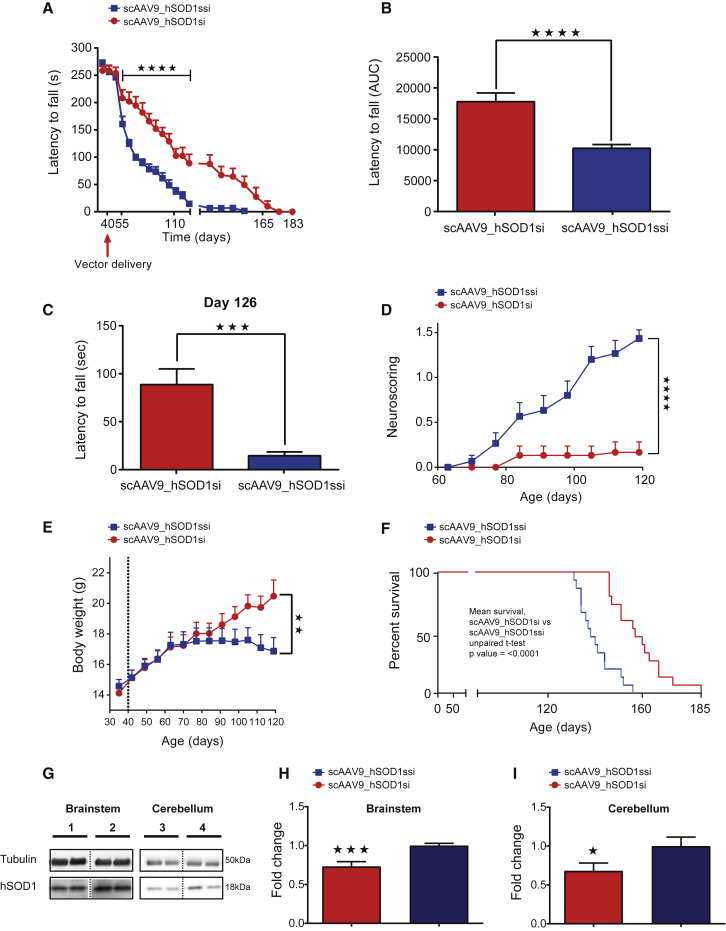
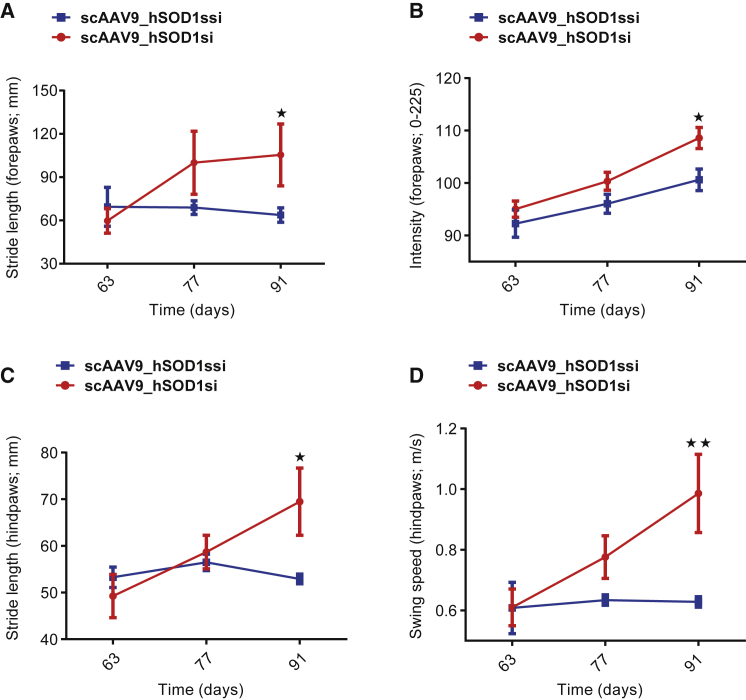
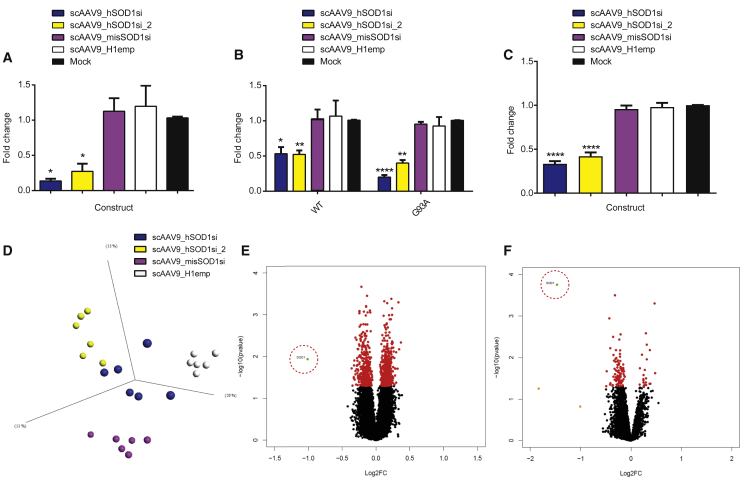
Of familial amyotrophic lateral sclerosis (fALS) cases, 20% are caused by mutations in the gene encoding human cytosolic Cu/Zn superoxide dismutase (hSOD1). Efficient translation of the therapeutic potential of RNAi for the treatment of SOD1-ALS patients requires the development of vectors that are free of significant off-target effects and with reliable biomarkers to discern sufficient target engagement and correct dosing. Using adeno-associated virus serotype 9 to deliver RNAi against hSOD1 in the SOD1G93A mouse model, we found that intrathecal injection of the therapeutic vector via the cisterna magna delayed onset of disease, decreased motor neuron death at end stage by up to 88%, and prolonged the median survival of SOD1G93A mice by up to 42%. To our knowledge, this is the first report to demonstrate no significant off-target effects linked to hSOD1 silencing, providing further confidence in the specificity of this approach. We also report the measurement of cerebrospinal fluid (CSF) hSOD1 protein levels as a biomarker of effective dosing and efficacy of hSOD1 knockdown. Together, these data provide further confidence in the safety of the clinical therapeutic vector. The CSF biomarker will be a useful measure of biological activity for translation into human clinical trials.
Keywords: AAV9; ALS; SOD1; biomarker; cisterna magna; clinical vector; motor neuron; neurodegeneration; off-target effects; shRNA.
Copyright © 2018 The Author(s). Published by Elsevier Inc. All rights reserved.
Figures
Similar articles
-
Genedrive kit for detecting single nucleotide polymorphism m.1555A>G in neonates and their mothers: a systematic review and cost-effectiveness analysis.Health Technol Assess. 2024 Oct;28(75):1-75. doi: 10.3310/TGAC4201. Health Technol Assess. 2024. PMID: 39487741 Free PMC article.
-
Depressing time: Waiting, melancholia, and the psychoanalytic practice of care.In: Kirtsoglou E, Simpson B, editors. The Time of Anthropology: Studies of Contemporary Chronopolitics. Abingdon: Routledge; 2020. Chapter 5. In: Kirtsoglou E, Simpson B, editors. The Time of Anthropology: Studies of Contemporary Chronopolitics. Abingdon: Routledge; 2020. Chapter 5. PMID: 36137063 Free Books & Documents. Review.
-
Using Experience Sampling Methodology to Capture Disclosure Opportunities for Autistic Adults.Autism Adulthood. 2023 Dec 1;5(4):389-400. doi: 10.1089/aut.2022.0090. Epub 2023 Dec 12. Autism Adulthood. 2023. PMID: 38116059 Free PMC article.
-
Qualitative evidence synthesis informing our understanding of people's perceptions and experiences of targeted digital communication.Cochrane Database Syst Rev. 2019 Oct 23;10(10):ED000141. doi: 10.1002/14651858.ED000141. Cochrane Database Syst Rev. 2019. PMID: 31643081 Free PMC article.
-
Continuing education meetings and workshops: effects on professional practice and healthcare outcomes.Cochrane Database Syst Rev. 2021 Sep 15;9(9):CD003030. doi: 10.1002/14651858.CD003030.pub3. Cochrane Database Syst Rev. 2021. PMID: 34523128 Free PMC article. Review.
Cited by
-
In vivo genome editing using novel AAV-PHP variants rescues motor function deficits and extends survival in a SOD1-ALS mouse model.Gene Ther. 2023 May;30(5):443-454. doi: 10.1038/s41434-022-00375-w. Epub 2022 Dec 1. Gene Ther. 2023. PMID: 36450833 Free PMC article.
-
Subpial delivery of adeno-associated virus 9-synapsin-caveolin-1 (AAV9-SynCav1) preserves motor neuron and neuromuscular junction morphology, motor function, delays disease onset, and extends survival in hSOD1G93A mice.Theranostics. 2022 Jul 11;12(12):5389-5403. doi: 10.7150/thno.72614. eCollection 2022. Theranostics. 2022. PMID: 35910808 Free PMC article.
-
Current and Future Prospects for Gene Therapy for Rare Genetic Diseases Affecting the Brain and Spinal Cord.Front Mol Neurosci. 2021 Oct 6;14:695937. doi: 10.3389/fnmol.2021.695937. eCollection 2021. Front Mol Neurosci. 2021. PMID: 34690692 Free PMC article. Review.
-
Combination AAV therapy with galectin-1 and SOD1 downregulation demonstrates superior therapeutic effect in a severe ALS mouse model.Mol Ther Methods Clin Dev. 2024 Aug 6;32(3):101312. doi: 10.1016/j.omtm.2024.101312. eCollection 2024 Sep 12. Mol Ther Methods Clin Dev. 2024. PMID: 39257530 Free PMC article.
-
Gene Therapy for ALS-A Perspective.Int J Mol Sci. 2019 Sep 6;20(18):4388. doi: 10.3390/ijms20184388. Int J Mol Sci. 2019. PMID: 31500113 Free PMC article. Review.
References
-
- Rosen D.R. Mutations in Cu/Zn superoxide dismutase gene are associated with familial amyotrophic lateral sclerosis. Nature. 1993;364:362. - PubMed
-
- Ferraiuolo L., Kirby J., Grierson A.J., Sendtner M., Shaw P.J. Molecular pathways of motor neuron injury in amyotrophic lateral sclerosis. Nat. Rev. Neurol. 2011;7:616–630. - PubMed
Grants and funding
LinkOut - more resources
Full Text Sources
Other Literature Sources
Miscellaneous
