

Skeletal muscle ceramides and relationship with insulin sensitivity after 2 weeks of simulated sedentary behaviour and recovery in healthy older adults
- PMID: 30194727
- PMCID: PMC6209761
- DOI: 10.1113/JP276798
Skeletal muscle ceramides and relationship with insulin sensitivity after 2 weeks of simulated sedentary behaviour and recovery in healthy older adults
Abstract
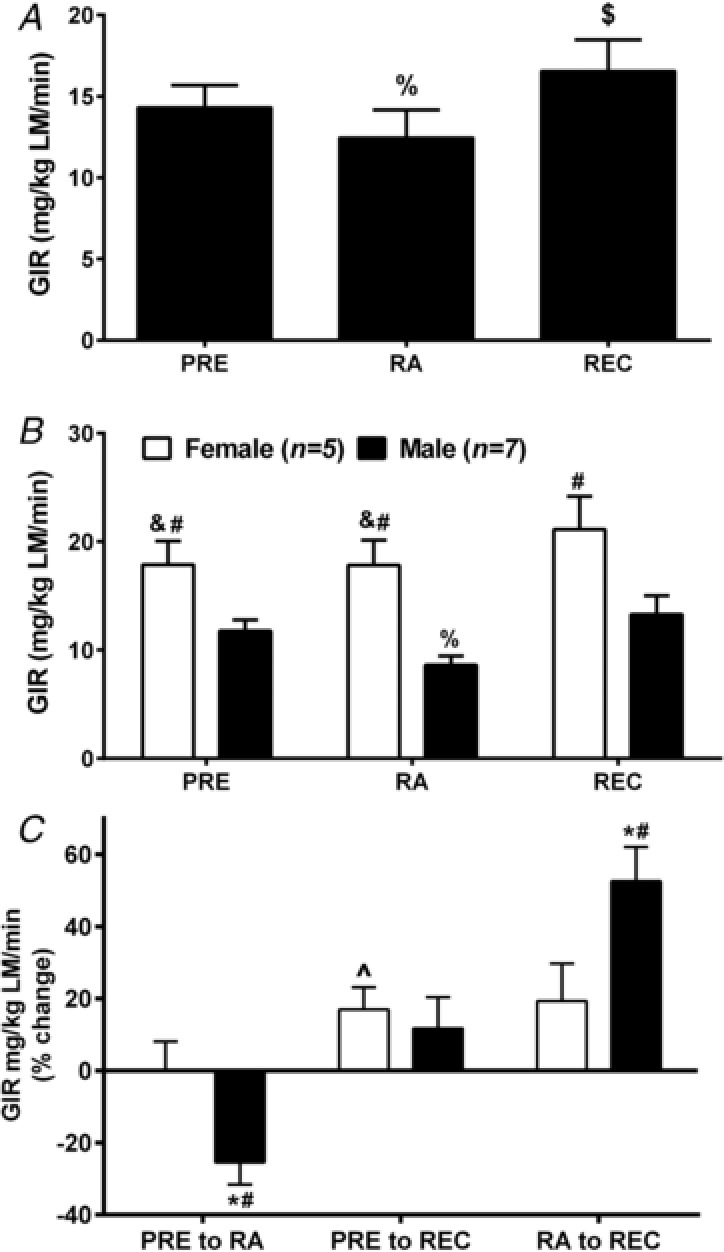
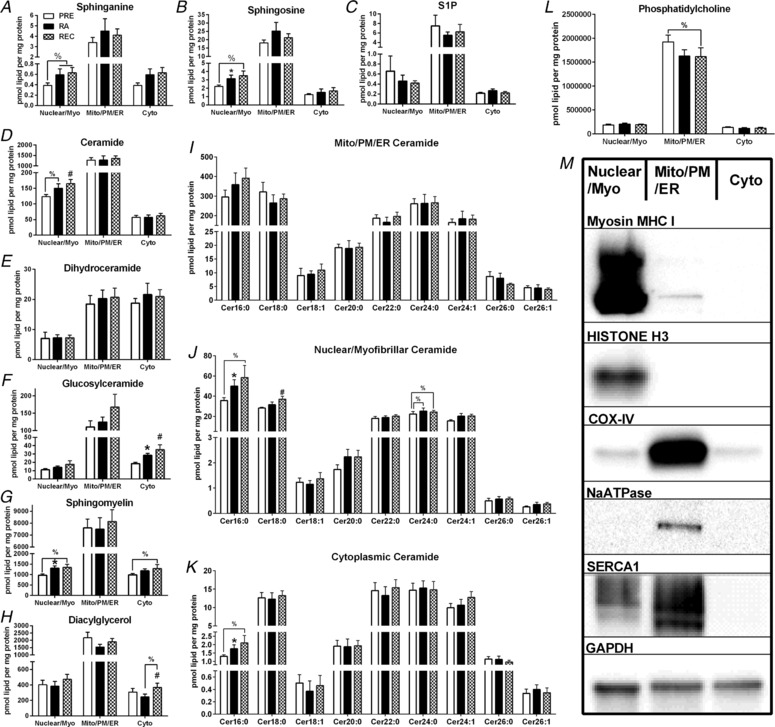
Key points: Insulin sensitivity (as determined by a hyperinsulinaemic-euglyceamic clamp) decreased 15% after reduced activity. Despite not fully returning to baseline physical activity levels, insulin sensitivity unexpectedly, rebounded above that recorded before 2 weeks of reduced physical activity by 14% after the recovery period. Changes in insulin sensitivity in response to reduced activity were primarily driven by men but, not women. There were modest changes in ceramides (nuclear/myofibrillar fraction and serum) following reduced activity and recovery but, in the absence of major changes to body composition (i.e. fat mass), ceramides were not related to changes in inactivity-induced insulin sensitivity in healthy older adults.
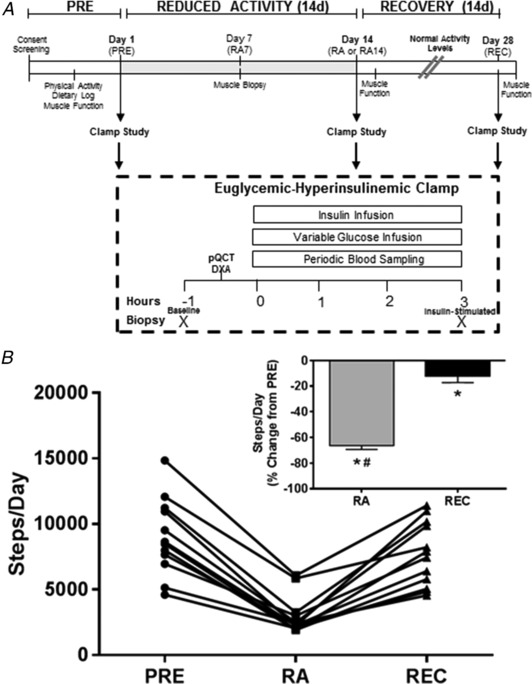
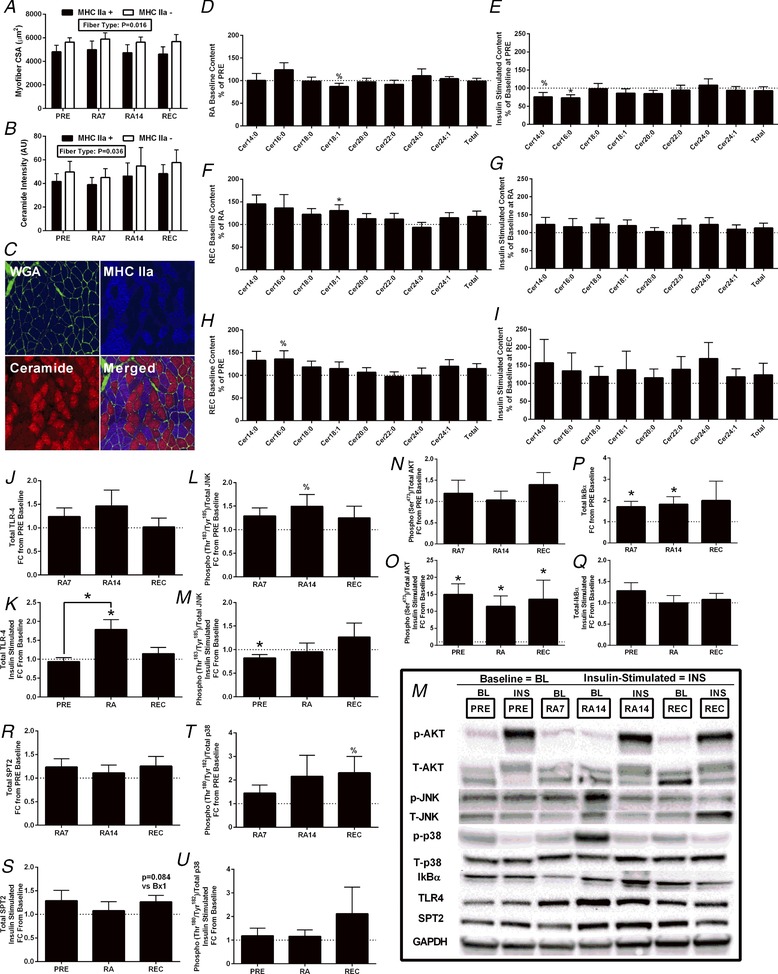
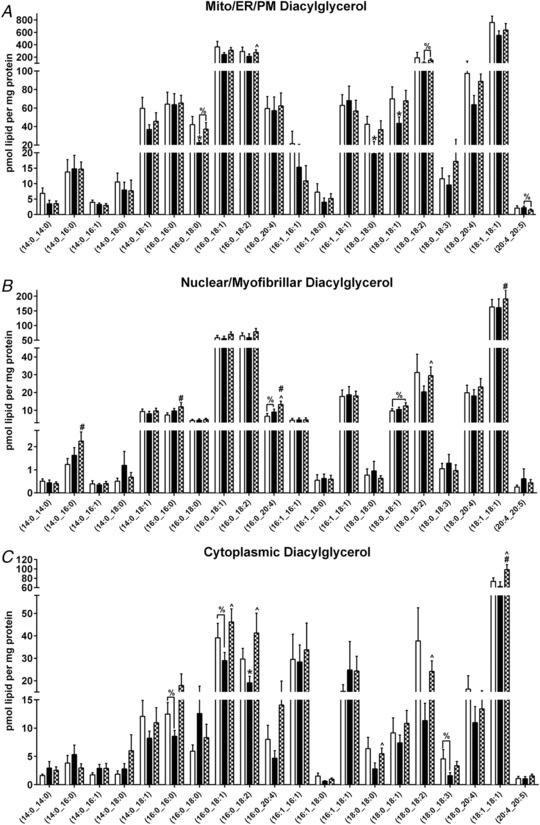
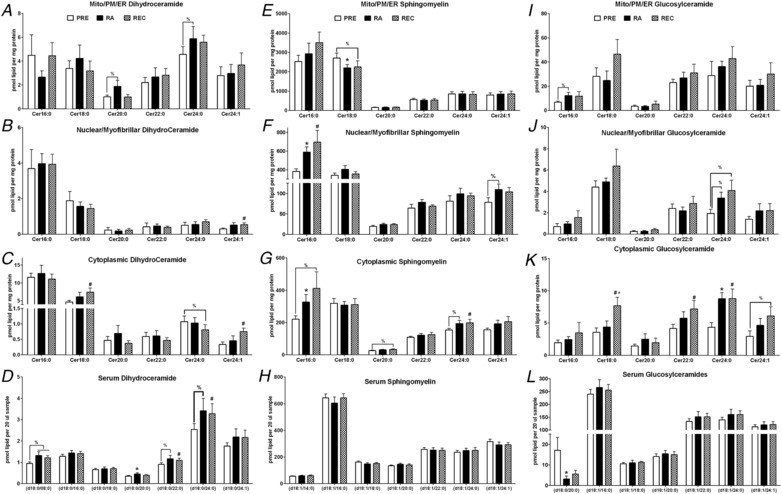
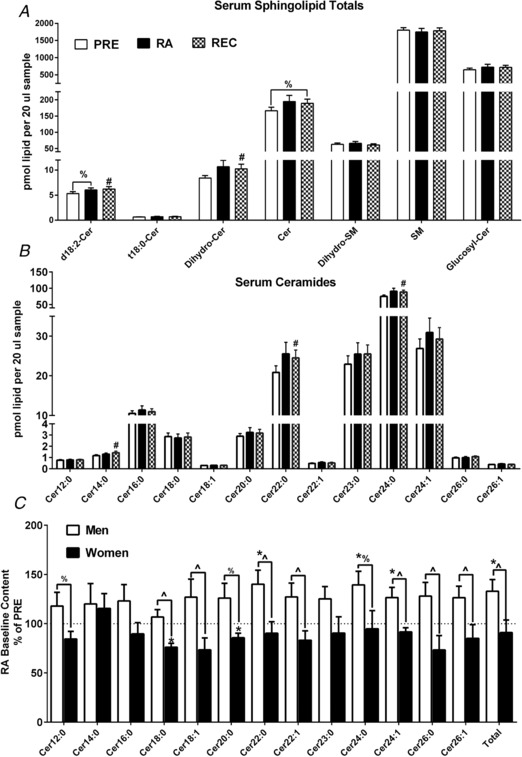
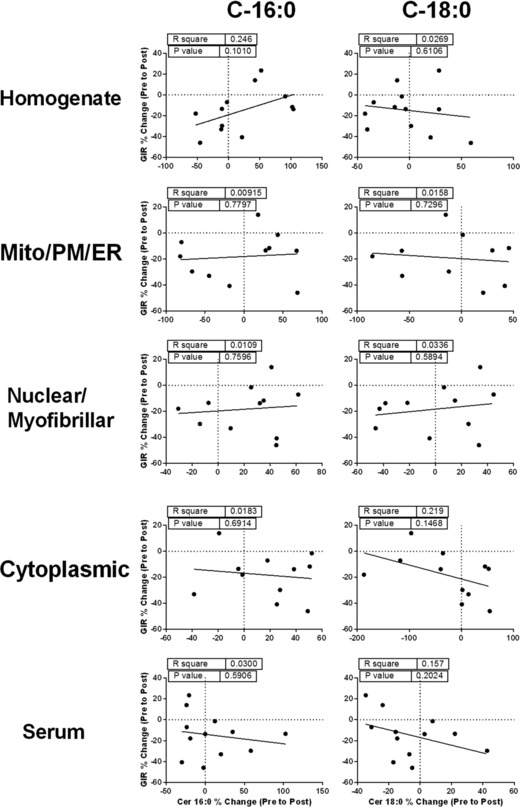
Abstract: Older adults are at risk of physical inactivity as they encounter debilitating life events. It is not known how insulin sensitivity is affected by modest short-term physical inactivity and recovery in healthy older adults, nor how insulin sensitivity is related to changes in serum and muscle ceramide content. Healthy older adults (aged 64-82 years, five females, seven males) were assessed before (PRE), after 2 weeks of reduced physical activity (RA) and following 2 weeks of recovery (REC). Insulin sensitivity (hyperinsulinaemic-euglyceamic clamp), lean mass, muscle function, skeletal muscle subfraction, fibre-specific, and serum ceramide content and indices of skeletal muscle inflammation were assessed. Insulin sensitivity decreased by 15 ± 6% at RA (driven by men) but rebounded above PRE by 14 ± 5% at REC. Mid-plantar flexor muscle area and leg strength decreased with RA, although only muscle size returned to baseline levels following REC. Body fat did not change and only minimal changes in muscle inflammation were noted across the intervention. Serum and intramuscular ceramides (nuclear/myofibrillar fraction) were modestly increased at RA and REC. However, ceramides were not related to changes in inactivity-induced insulin sensitivity in healthy older adults. Short-term inactivity induced insulin resistance in older adults in the absence of significant changes in body composition (i.e. fat mass) are not related to changes in ceramides.
Keywords: aging; metabolism; physical inactivity; reduced activity.
© 2018 The Authors. The Journal of Physiology © 2018 The Physiological Society.
Figures
Comment in
-
When gain is greater than loss: effects of physical activity on insulin sensitivity after short-term inactivity in older subjects.J Physiol. 2018 Nov;596(21):5071-5072. doi: 10.1113/JP277110. Epub 2018 Oct 4. J Physiol. 2018. PMID: 30211450 Free PMC article. No abstract available.
-
Physical inactivity-induced insulin resistance: could alterations to the vasculature be to blame?J Physiol. 2019 Jan;597(2):375-376. doi: 10.1113/JP277323. Epub 2018 Nov 24. J Physiol. 2019. PMID: 30414182 Free PMC article. No abstract available.
Similar articles
-
Influence of Exercise Training on Skeletal Muscle Insulin Resistance in Aging: Spotlight on Muscle Ceramides.Int J Mol Sci. 2020 Feb 22;21(4):1514. doi: 10.3390/ijms21041514. Int J Mol Sci. 2020. PMID: 32098447 Free PMC article. Review.
-
An accumulation of muscle macrophages is accompanied by altered insulin sensitivity after reduced activity and recovery.Acta Physiol (Oxf). 2019 Jun;226(2):e13251. doi: 10.1111/apha.13251. Epub 2019 Jan 30. Acta Physiol (Oxf). 2019. PMID: 30632274 Free PMC article.
-
Muscle-Saturated Bioactive Lipids Are Increased with Aging and Influenced by High-Intensity Interval Training.Int J Mol Sci. 2019 Mar 12;20(5):1240. doi: 10.3390/ijms20051240. Int J Mol Sci. 2019. PMID: 30871020 Free PMC article.
-
Skeletal muscle ceramides do not contribute to physical-inactivity-induced insulin resistance.Appl Physiol Nutr Metab. 2019 Nov;44(11):1180-1188. doi: 10.1139/apnm-2018-0850. Epub 2019 Mar 19. Appl Physiol Nutr Metab. 2019. PMID: 30889368
-
Insulin resistance with aging: effects of diet and exercise.Sports Med. 2000 Nov;30(5):327-46. doi: 10.2165/00007256-200030050-00002. Sports Med. 2000. PMID: 11103847 Review.
Cited by
-
Effects of the COVID-19 Pandemic on Physical Function of Community-Dwelling People with Disabilities in Japan.Int J Environ Res Public Health. 2022 Oct 2;19(19):12599. doi: 10.3390/ijerph191912599. Int J Environ Res Public Health. 2022. PMID: 36231898 Free PMC article.
-
The Developmental Implications of Muscle-Targeted Magnetic Mitohormesis: A Human Health and Longevity Perspective.Bioengineering (Basel). 2023 Aug 12;10(8):956. doi: 10.3390/bioengineering10080956. Bioengineering (Basel). 2023. PMID: 37627841 Free PMC article. Review.
-
Influence of Exercise Training on Skeletal Muscle Insulin Resistance in Aging: Spotlight on Muscle Ceramides.Int J Mol Sci. 2020 Feb 22;21(4):1514. doi: 10.3390/ijms21041514. Int J Mol Sci. 2020. PMID: 32098447 Free PMC article. Review.
-
Magnetic field therapy enhances muscle mitochondrial bioenergetics and attenuates systemic ceramide levels following ACL reconstruction: Southeast Asian randomized-controlled pilot trial.J Orthop Translat. 2022 Oct 13;35:99-112. doi: 10.1016/j.jot.2022.09.011. eCollection 2022 Jul. J Orthop Translat. 2022. PMID: 36262374 Free PMC article.
-
Changes in Membrane Ceramide Pools in Rat Soleus Muscle in Response to Short-Term Disuse.Int J Mol Sci. 2019 Sep 30;20(19):4860. doi: 10.3390/ijms20194860. Int J Mol Sci. 2019. PMID: 31574943 Free PMC article.
References
-
- Amati F, Dubé JJ, Alvarez‐Carnero E, Edreira MM, Chomentowski P, Coen PM, Switzer GE, Bickel PE, Stefanovic‐Racic M, Toledo FGS & Goodpaster BH (2011). Skeletal muscle triglycerides, diacylglycerols, and ceramides in insulin resistance: another paradox in endurance‐trained athletes? F1000Prime 60, 2588–2597. - PMC - PubMed
-
- Bell KE, von Allmen MT, Devries MC & Phillips SM (2016). Muscle disuse as a pivotal problem in sarcopenia‐related muscle loss and dysfunction. J Frailty Aging 5, 33–41. - PubMed
-
- Bergman BC, Perreault L, Strauss A, Bacon S, Kerege A, Harrison K, Brozinick JT, Hunerdosse DM, Playdon MC, Holmes W, Bui HH, Sanders P, Siddall P, Wei T, Thomas MK, Kuo MS & Eckel RH (2018). Intramuscular triglyceride synthesis: importance in muscle lipid partitioning in humans. Am J Physiol Endocrinol Metab 314, E152–E164. - PMC - PubMed
-
- Bergouignan A, Rudwill F, Simon C & Blanc S (2011). Physical inactivity as the culprit of metabolic inflexibility: evidence from bed‐rest studies. J Appl Physiol 111, 1201–1210. - PubMed
Publication types
MeSH terms
Substances
Grants and funding
LinkOut - more resources
Full Text Sources
Other Literature Sources
Medical