

Concentration of Lactoferrin in Human Milk and Its Variation during Lactation in Different Chinese Populations
- PMID: 30189612
- PMCID: PMC6163804
- DOI: 10.3390/nu10091235
Concentration of Lactoferrin in Human Milk and Its Variation during Lactation in Different Chinese Populations
Abstract
Background: Lactoferrin (Lf) is a multifunctional protein and one of the most abundant proteins in human milk. Various factors may affect its concentration in human milk, such as stage of lactation, ethnicity, and diet.
Objectives: The objectives of the present study were to examine the dynamic change in milk Lf throughout the course of lactation and explore factors associated with milk Lf concentrations in various Chinese populations.
Methods: This investigation was a part of a large cross-sectional study conducted in 11 provinces/autonomous regions/municipalities (Beijing, Gansu, Guangdong, Guangxi, Heilongjiang, Inner Mongolia, Shandong, Shanghai, Xinjiang, Yunnan, and Zhejiang) across China between 2011 and 2013. Lactating women (n = 6481) within 0⁻330 days postpartum were recruited in the original study. A sub-sample of 824 women was randomly selected, and milk Lf concentrations were determined by UPLC/MS.
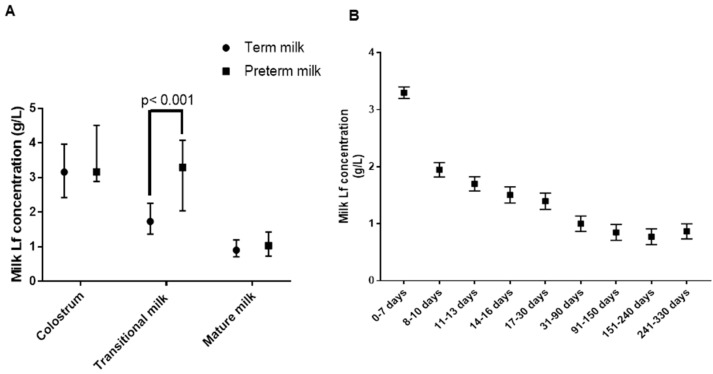
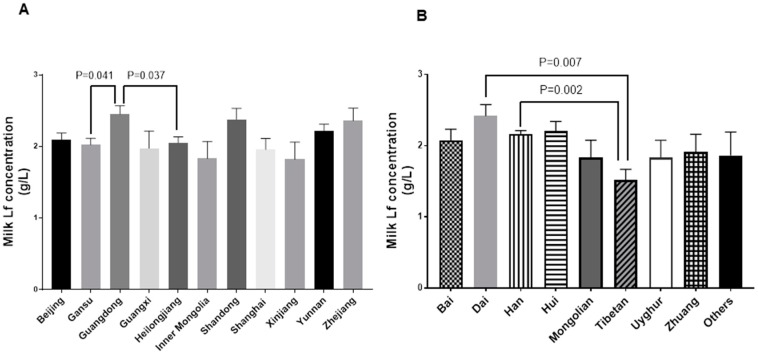
Results: The Lf concentration in milk from women delivering at term was 3.16 g/L, 1.73 g/L and 0.90 g/L for colostrum, transitional milk, and mature milk, respectively. Lf concentrations differed significantly between stages of lactation (colostrum vs. transitional milk, colostrum vs. mature milk, transitional milk vs. mature milk, all p < 0.001). Maternal BMI, age, mode of delivery, parturition, protein intake, and serum albumin concentration were not correlated with milk Lf concentration. However, milk Lf concentrations varied among different geographical regions (Guangdong (1.91 g/L) vs. Heilongjiang (1.44 g/L), p = 0.037; Guangdong (1.91 g/L) vs. Gansu (1.43 g/L), p = 0.041) and ethnicities (Dai (1.80 g/L) vs. Tibetan (0.99 g/L), p = 0.007; Han (1.62 g/L) vs. Tibetan (0.99 g/L), p = 0.002) in China.
Conclusions: The concentration of Lf in human milk changes dynamically throughout lactation. Few maternal characteristics affect the milk Lf concentration, but it varies across different geographical regions and ethnicities in China.
Keywords: Chinese populations; Lactoferrin; breast milk; concentration; maternal factors.
Conflict of interest statement
The authors declare no conflicts of interest.
Figures
Similar articles
-
Human Milk Oligosaccharides Are Associated with Lactation Stage and Lewis Phenotype in a Chinese Population.Nutrients. 2023 Mar 15;15(6):1408. doi: 10.3390/nu15061408. Nutrients. 2023. PMID: 36986137 Free PMC article.
-
Lactoferrin in Human Milk of Prolonged Lactation.Nutrients. 2019 Oct 2;11(10):2350. doi: 10.3390/nu11102350. Nutrients. 2019. PMID: 31581741 Free PMC article.
-
Human milk cholesterol is associated with lactation stage and maternal plasma cholesterol in Chinese populations.Pediatr Res. 2022 Mar;91(4):970-976. doi: 10.1038/s41390-021-01440-7. Epub 2021 Apr 12. Pediatr Res. 2022. PMID: 33846555
-
Factors affecting lactoferrin concentration in human milk: how much do we know?Biochem Cell Biol. 2017 Feb;95(1):12-21. doi: 10.1139/bcb-2016-0060. Epub 2016 Aug 4. Biochem Cell Biol. 2017. PMID: 28075610 Free PMC article. Review.
-
The Mean of Milk: A Review of Human Milk Oligosaccharide Concentrations throughout Lactation.Nutrients. 2021 Aug 9;13(8):2737. doi: 10.3390/nu13082737. Nutrients. 2021. PMID: 34444897 Free PMC article. Review.
Cited by
-
Understanding the Elements of Maternal Protection from Systemic Bacterial Infections during Early Life.Nutrients. 2020 Apr 10;12(4):1045. doi: 10.3390/nu12041045. Nutrients. 2020. PMID: 32290170 Free PMC article. Review.
-
Associations of human milk oligosaccharides and bioactive proteins with infant growth and development among Malawian mother-infant dyads.Am J Clin Nutr. 2021 Jan 4;113(1):209-220. doi: 10.1093/ajcn/nqaa272. Am J Clin Nutr. 2021. PMID: 33096556 Free PMC article.
-
Comparative Proteomics of Human Milk From Eight Cities in China During Six Months of Lactation in the Chinese Human Milk Project Study.Front Nutr. 2021 Aug 12;8:682429. doi: 10.3389/fnut.2021.682429. eCollection 2021. Front Nutr. 2021. PMID: 34458300 Free PMC article.
-
Associations of Human Milk Oligosaccharides and Bioactive Proteins with Infant Morbidity and Inflammation in Malawian Mother-Infant Dyads.Curr Dev Nutr. 2021 Apr 29;5(5):nzab072. doi: 10.1093/cdn/nzab072. eCollection 2021 May. Curr Dev Nutr. 2021. PMID: 34084993 Free PMC article.
-
Effects of human donor milk on gut barrier function and inflammation: in vitro study of the beneficial properties to the newborn.Front Immunol. 2023 Nov 8;14:1282144. doi: 10.3389/fimmu.2023.1282144. eCollection 2023. Front Immunol. 2023. PMID: 38022652 Free PMC article.
References
-
- Zavaleta N., Figueroa D., Rivera J., Sanchez J., Alfaro S., Lonnerdal B. Efficacy of rice-based oral rehydration solution containing recombinant human lactoferrin and lysozyme in Peruvian children with acute diarrhea. J. Pediatr. Gastroenterol. Nutr. 2007;44:258–264. doi: 10.1097/MPG.0b013e31802c41b7. - DOI - PubMed
-
- Ochoa T.J., Chea-Woo E., Baiocchi N., Pecho I., Campos M., Prada A., Valdiviezo G., Lluque A., Lai D., Cleary T.G. Randomized double-blind controlled trial of bovine lactoferrin for prevention of diarrhea in children. J. Pediatr. 2013;162:349–356. doi: 10.1016/j.jpeds.2012.07.043. - DOI - PMC - PubMed
-
- Manzoni P., Rinaldi M., Cattani S., Pugni L., Romeo M.G., Messner H., Stolfi I., Decembrino L., Laforgia N., Vagnarelli F., et al. Bovine lactoferrin supplementation for prevention of late-onset sepsis in very low-birth-weight neonates: A randomized trial. JAMA. 2009;302:1421–1428. doi: 10.1001/jama.2009.1403. - DOI - PubMed
Publication types
MeSH terms
Substances
Grants and funding
LinkOut - more resources
Full Text Sources
Other Literature Sources
Medical
Miscellaneous
