

New software tools in EMAN2 inspired by EMDatabank map challenge
- PMID: 30189321
- PMCID: PMC6163079
- DOI: 10.1016/j.jsb.2018.09.002
New software tools in EMAN2 inspired by EMDatabank map challenge
Abstract
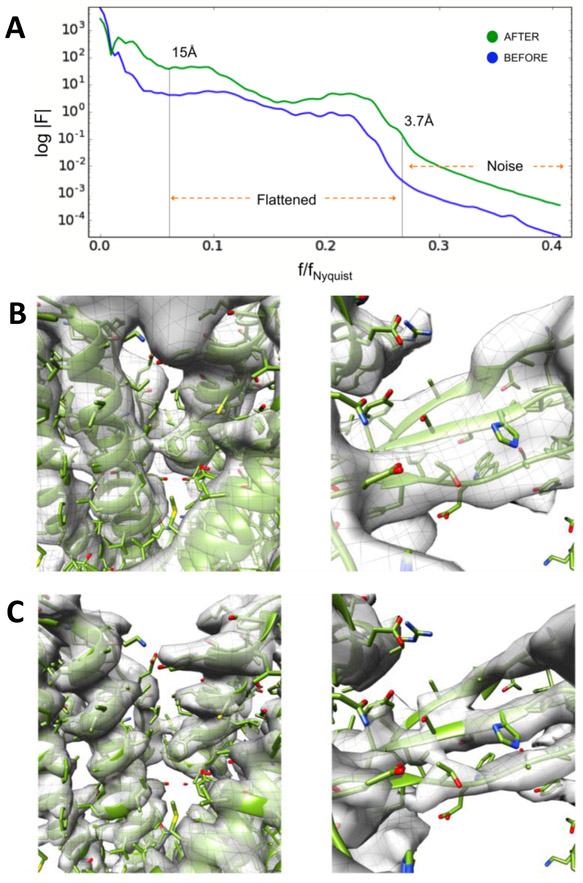
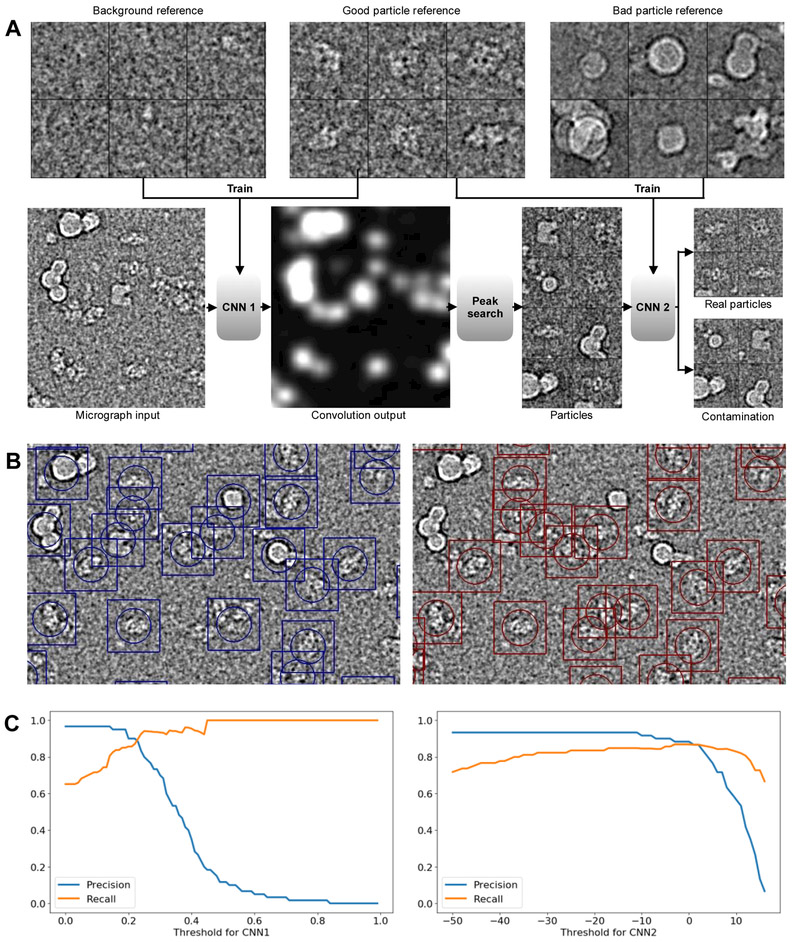
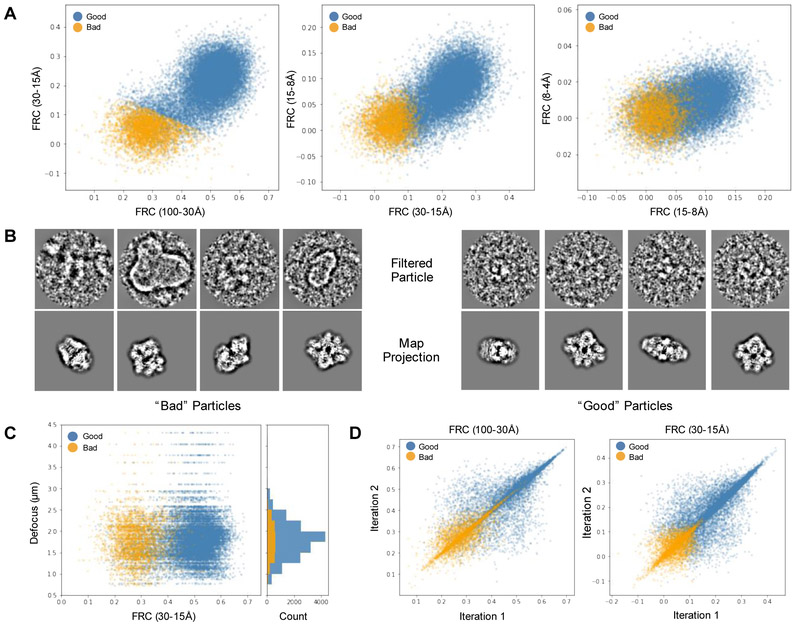
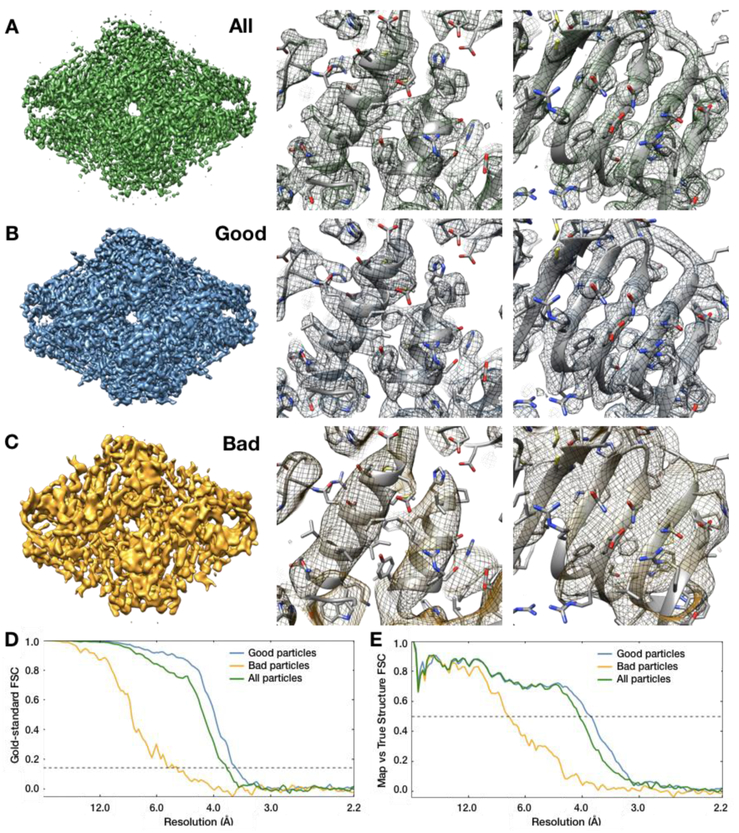
EMAN2 is an extensible software suite with complete workflows for performing high-resolution single particle analysis, 2-D and 3-D heterogeneity analysis, and subtomogram averaging, among other tasks. Participation in the recent CryoEM Map Challenge sponsored by the EMDatabank led to a number of significant improvements to the single particle analysis process in EMAN2. A new convolutional neural network particle picker was developed, which dramatically improves particle picking accuracy for difficult data sets. A new particle quality metric capable of accurately identifying "bad" particles with a high degree of accuracy, no human input, and a negligible amount of additional computation, has been introduced, and this now serves as a replacement for earlier human-biased methods. The way 3-D single particle reconstructions are filtered has been altered to be more comparable to the filter applied in several other popular software packages, dramatically improving the appearance of sidechains in high-resolution structures. Finally, an option has been added to perform local resolution-based iterative filtration, resulting in local resolution improvements in many maps.
Keywords: 3-D reconstruction; CryoEM; EMDatabank map challenge; Image processing; Single particle analysis; Structural biology.
Copyright © 2018 Elsevier Inc. All rights reserved.
Figures
Similar articles
-
High resolution single particle refinement in EMAN2.1.Methods. 2016 May 1;100:25-34. doi: 10.1016/j.ymeth.2016.02.018. Epub 2016 Feb 27. Methods. 2016. PMID: 26931650 Free PMC article.
-
Single-Particle Refinement and Variability Analysis in EMAN2.1.Methods Enzymol. 2016;579:159-89. doi: 10.1016/bs.mie.2016.05.001. Epub 2016 Jul 1. Methods Enzymol. 2016. PMID: 27572727 Free PMC article. Review.
-
Single particle tomography in EMAN2.J Struct Biol. 2015 Jun;190(3):279-90. doi: 10.1016/j.jsb.2015.04.016. Epub 2015 May 5. J Struct Biol. 2015. PMID: 25956334 Free PMC article.
-
DRPnet: automated particle picking in cryo-electron micrographs using deep regression.BMC Bioinformatics. 2021 Feb 8;22(1):55. doi: 10.1186/s12859-020-03948-x. BMC Bioinformatics. 2021. PMID: 33557750 Free PMC article.
-
Testing the Validity of Single-Particle Maps at Low and High Resolution.Methods Enzymol. 2016;579:227-53. doi: 10.1016/bs.mie.2016.06.004. Epub 2016 Aug 8. Methods Enzymol. 2016. PMID: 27572729 Review.
Cited by
-
HIV-1 Vpu protein forms stable oligomers in aqueous solution via its transmembrane domain self-association.Sci Rep. 2023 Sep 6;13(1):14691. doi: 10.1038/s41598-023-41873-0. Sci Rep. 2023. PMID: 37673923 Free PMC article.
-
Computational Methods Toward Unbiased Pattern Mining and Structure Determination in Cryo-Electron Tomography Data.J Mol Biol. 2023 May 1;435(9):168068. doi: 10.1016/j.jmb.2023.168068. Epub 2023 Mar 31. J Mol Biol. 2023. PMID: 37003470 Free PMC article. Review.
-
O-GlcNAc forces an α-synuclein amyloid strain with notably diminished seeding and pathology.Nat Chem Biol. 2024 May;20(5):646-655. doi: 10.1038/s41589-024-01551-2. Epub 2024 Feb 12. Nat Chem Biol. 2024. PMID: 38347213 Free PMC article.
-
Teneurin4 dimer structures reveal a calcium-stabilized compact conformation supporting homomeric trans-interactions.EMBO J. 2022 May 2;41(9):e107505. doi: 10.15252/embj.2020107505. Epub 2022 Jan 31. EMBO J. 2022. PMID: 35099835 Free PMC article.
-
Structural basis of substrate progression through the bacterial chaperonin cycle.Proc Natl Acad Sci U S A. 2023 Dec 12;120(50):e2308933120. doi: 10.1073/pnas.2308933120. Epub 2023 Dec 8. Proc Natl Acad Sci U S A. 2023. PMID: 38064510 Free PMC article.
References
Publication types
MeSH terms
Grants and funding
LinkOut - more resources
Full Text Sources
Other Literature Sources
Research Materials
