

Altered ER-mitochondria contact impacts mitochondria calcium homeostasis and contributes to neurodegeneration in vivo in disease models
- PMID: 30185553
- PMCID: PMC6156612
- DOI: 10.1073/pnas.1721136115
Altered ER-mitochondria contact impacts mitochondria calcium homeostasis and contributes to neurodegeneration in vivo in disease models
Erratum in
-
Correction for Lee et al., Altered ER-mitochondria contact impacts mitochondria calcium homeostasis and contributes to neurodegeneration in vivo in disease models.Proc Natl Acad Sci U S A. 2018 Oct 16;115(42):E9992. doi: 10.1073/pnas.1815900115. Epub 2018 Oct 8. Proc Natl Acad Sci U S A. 2018. PMID: 30297410 Free PMC article. No abstract available.
Abstract
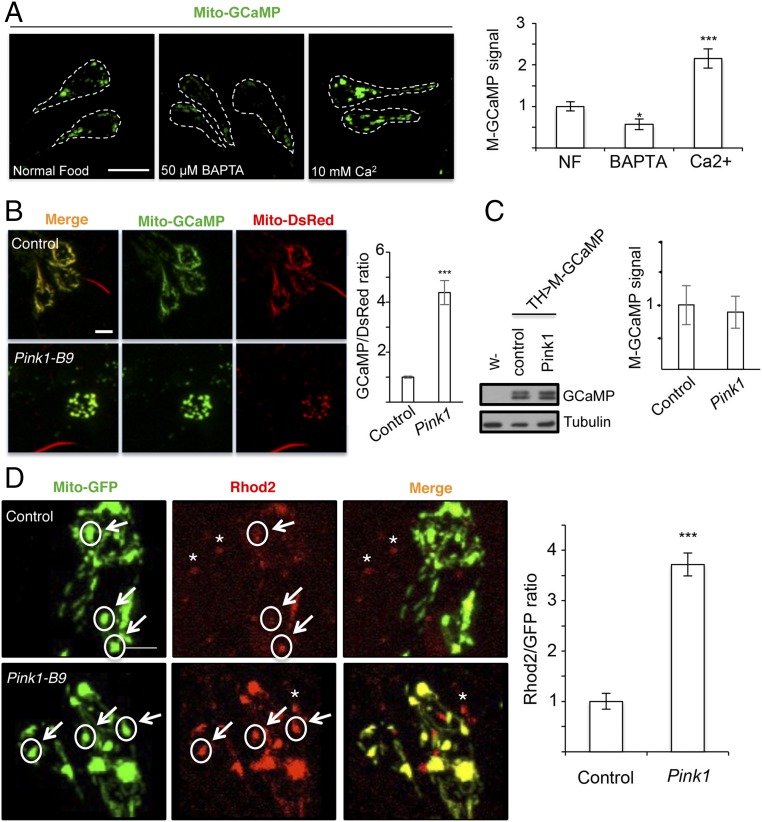
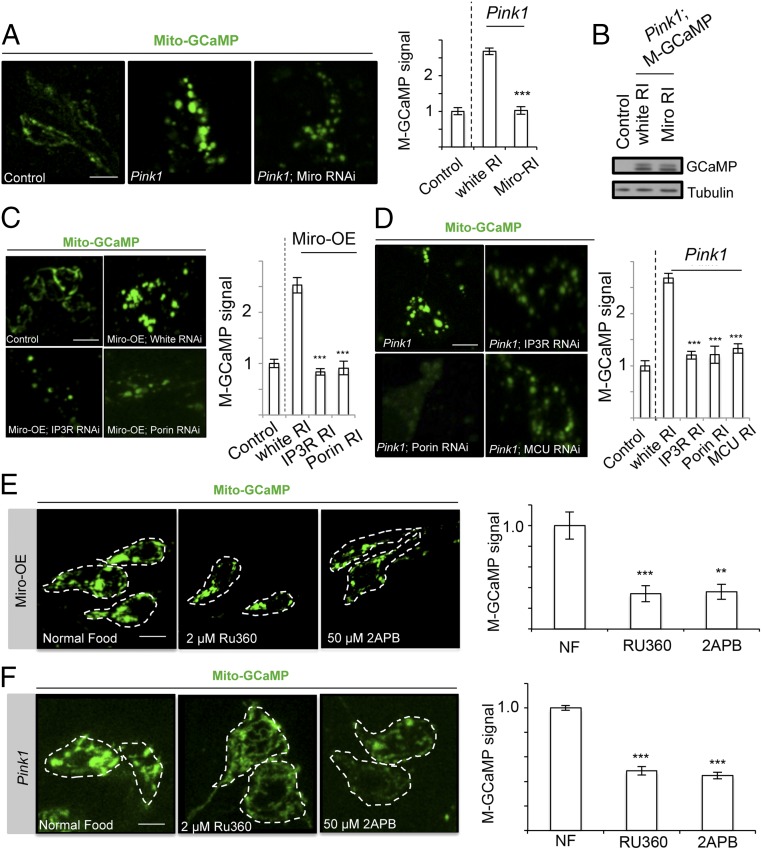
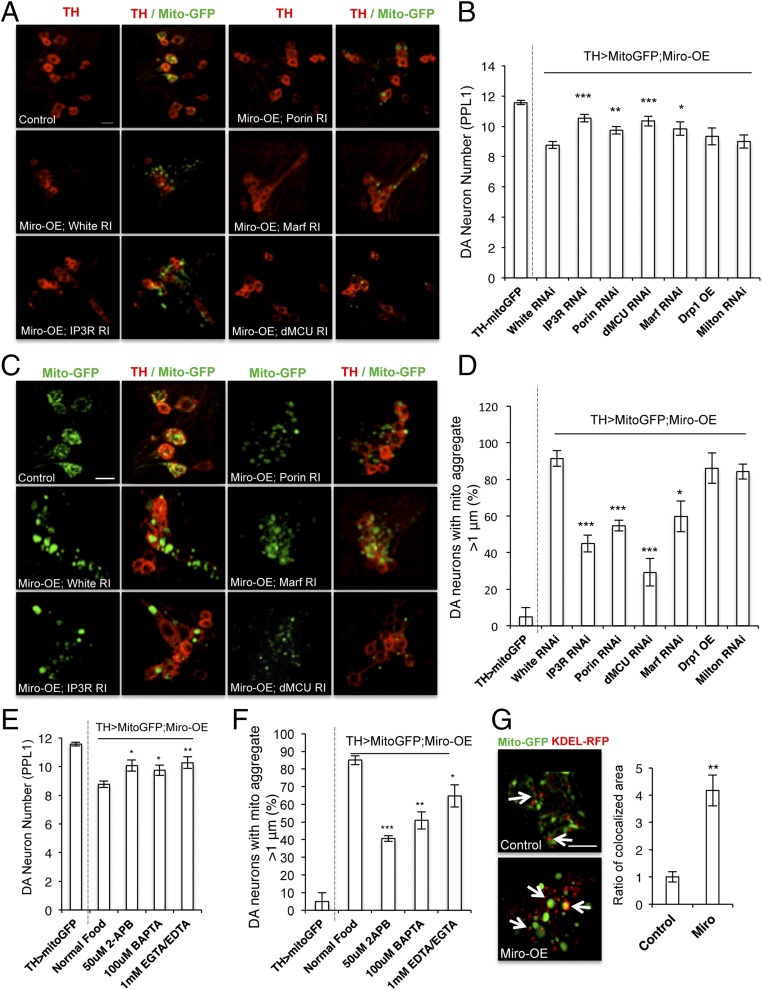
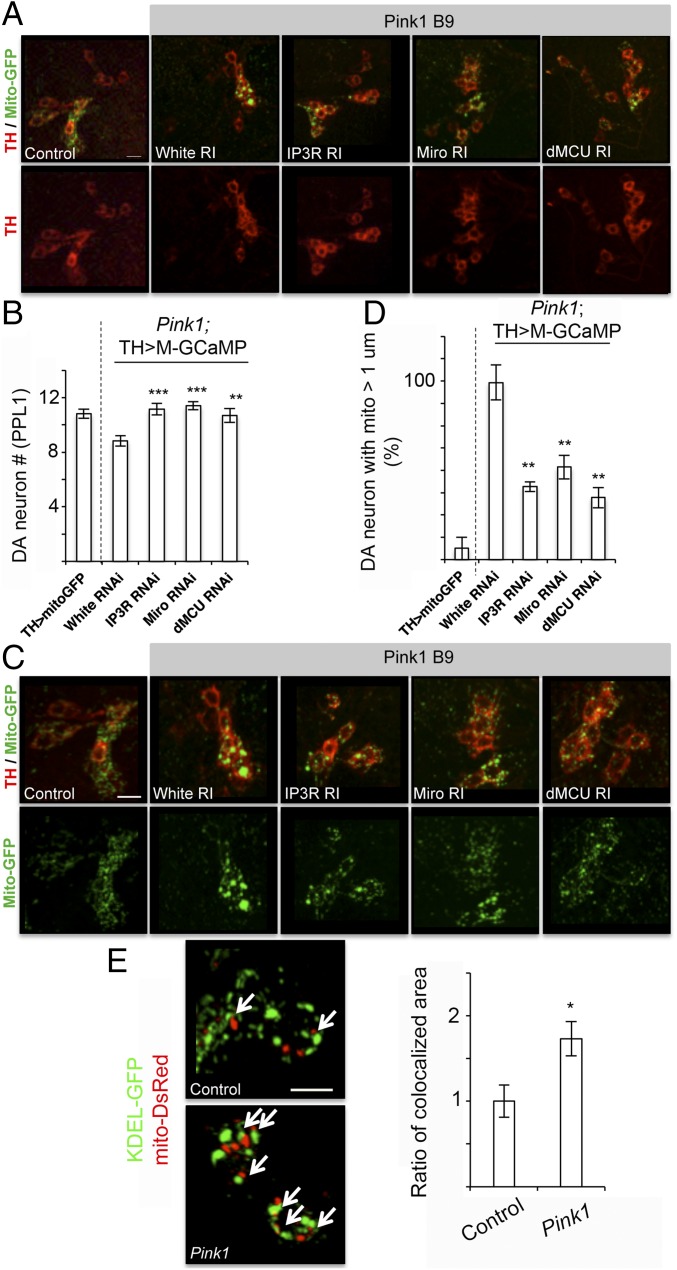
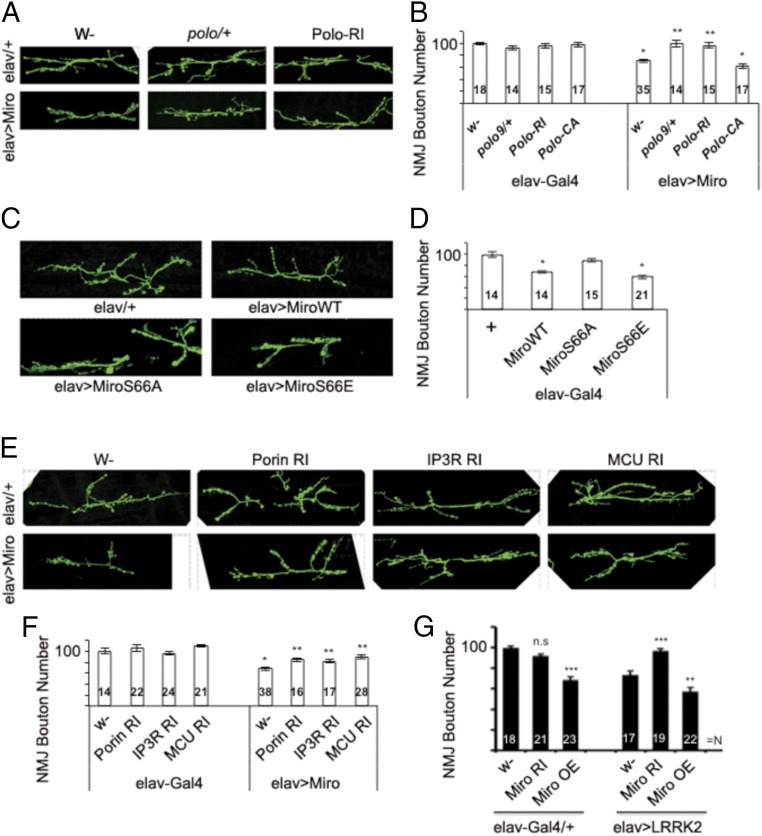
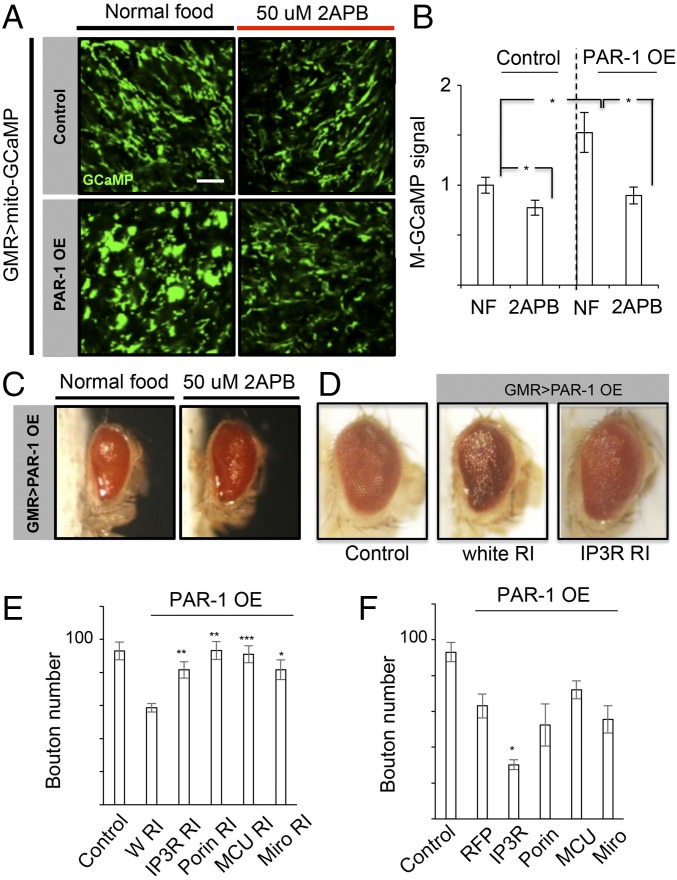
Calcium (Ca2+) homeostasis is essential for neuronal function and survival. Altered Ca2+ homeostasis has been consistently observed in neurological diseases. How Ca2+ homeostasis is achieved in various cellular compartments of disease-relevant cell types is not well understood. Here we show in Drosophila Parkinson's disease (PD) models that Ca2+ transport from the endoplasmic reticulum (ER) to mitochondria through the ER-mitochondria contact site (ERMCS) critically regulates mitochondrial Ca2+ (mito-Ca2+) homeostasis in dopaminergic (DA) neurons, and that the PD-associated PINK1 protein modulates this process. In PINK1 mutant DA neurons, the ERMCS is strengthened and mito-Ca2+ level is elevated, resulting in mitochondrial enlargement and neuronal death. Miro, a well-characterized component of the mitochondrial trafficking machinery, mediates the effects of PINK1 on mito-Ca2+ and mitochondrial morphology, apparently in a transport-independent manner. Miro overexpression mimics PINK1 loss-of-function effect, whereas inhibition of Miro or components of the ERMCS, or pharmacological modulation of ERMCS function, rescued PINK1 mutant phenotypes. Mito-Ca2+ homeostasis is also altered in the LRRK2-G2019S model of PD and the PAR-1/MARK model of neurodegeneration, and genetic or pharmacological restoration of mito-Ca2+ level is beneficial in these models. Our results highlight the importance of mito-Ca2+ homeostasis maintained by Miro and the ERMCS to mitochondrial physiology and neuronal integrity. Targeting this mito-Ca2+ homeostasis pathway holds promise for a therapeutic strategy for neurodegenerative diseases.
Keywords: ER–mitochondria contact site; Miro; PINK1; Parkinson’s disease; calcium homeostasis.
Conflict of interest statement
The authors declare no conflict of interest.
Figures
Similar articles
-
Polo Kinase Phosphorylates Miro to Control ER-Mitochondria Contact Sites and Mitochondrial Ca(2+) Homeostasis in Neural Stem Cell Development.Dev Cell. 2016 Apr 18;37(2):174-189. doi: 10.1016/j.devcel.2016.03.023. Dev Cell. 2016. PMID: 27093086 Free PMC article.
-
PINK1-mediated phosphorylation of Miro inhibits synaptic growth and protects dopaminergic neurons in Drosophila.Sci Rep. 2014 Nov 7;4:6962. doi: 10.1038/srep06962. Sci Rep. 2014. PMID: 25376463 Free PMC article.
-
Parkinson's disease-associated kinase PINK1 regulates Miro protein level and axonal transport of mitochondria.PLoS Genet. 2012;8(3):e1002537. doi: 10.1371/journal.pgen.1002537. Epub 2012 Mar 1. PLoS Genet. 2012. PMID: 22396657 Free PMC article.
-
LRRK2 and mitochondria: Recent advances and current views.Brain Res. 2019 Jan 1;1702:96-104. doi: 10.1016/j.brainres.2018.06.010. Epub 2018 Jun 9. Brain Res. 2019. PMID: 29894679 Free PMC article. Review.
-
Disease model organism for Parkinson disease: Drosophila melanogaster.BMB Rep. 2019 Apr;52(4):250-258. doi: 10.5483/BMBRep.2019.52.4.204. BMB Rep. 2019. PMID: 30545438 Free PMC article. Review.
Cited by
-
Mitochondrial Quality Control Strategies: Potential Therapeutic Targets for Neurodegenerative Diseases?Front Neurosci. 2021 Nov 12;15:746873. doi: 10.3389/fnins.2021.746873. eCollection 2021. Front Neurosci. 2021. PMID: 34867159 Free PMC article. Review.
-
Decreasing pdzd8-mediated mito-ER contacts improves organismal fitness and mitigates Aβ42 toxicity.Life Sci Alliance. 2022 Jul 13;5(11):e202201531. doi: 10.26508/lsa.202201531. Print 2022 Nov. Life Sci Alliance. 2022. PMID: 35831024 Free PMC article.
-
Pioglitazone Improves the Function of Human Mesenchymal Stem Cells in Chronic Kidney Disease Patients.Int J Mol Sci. 2019 May 10;20(9):2314. doi: 10.3390/ijms20092314. Int J Mol Sci. 2019. PMID: 31083336 Free PMC article.
-
Mff oligomerization is required for Drp1 activation and synergy with actin filaments during mitochondrial division.Mol Biol Cell. 2021 Oct 1;32(20):ar5. doi: 10.1091/mbc.E21-04-0224. Epub 2021 Aug 4. Mol Biol Cell. 2021. PMID: 34347505 Free PMC article.
-
Mitochondrial Miro GTPases coordinate mitochondrial and peroxisomal dynamics.Small GTPases. 2021 Sep-Nov;12(5-6):372-398. doi: 10.1080/21541248.2020.1843957. Epub 2020 Nov 12. Small GTPases. 2021. PMID: 33183150 Free PMC article. Review.
References
-
- Chan DC. Mitochondria: Dynamic organelles in disease, aging, and development. Cell. 2006;125:1241–1252. - PubMed
MeSH terms
Substances
Grants and funding
LinkOut - more resources
Full Text Sources
Other Literature Sources
Medical
Molecular Biology Databases
Miscellaneous
