PKCε contributes to lipid-induced insulin resistance through cross talk with p70S6K and through previously unknown regulators of insulin signaling
- PMID: 30181290
- PMCID: PMC6156646
- DOI: 10.1073/pnas.1804379115
PKCε contributes to lipid-induced insulin resistance through cross talk with p70S6K and through previously unknown regulators of insulin signaling
Abstract
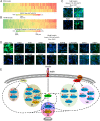
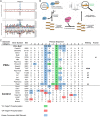
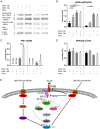
Insulin resistance drives the development of type 2 diabetes (T2D). In liver, diacylglycerol (DAG) is a key mediator of lipid-induced insulin resistance. DAG activates protein kinase C ε (PKCε), which phosphorylates and inhibits the insulin receptor. In rats, a 3-day high-fat diet produces hepatic insulin resistance through this mechanism, and knockdown of hepatic PKCε protects against high-fat diet-induced hepatic insulin resistance. Here, we employed a systems-level approach to uncover additional signaling pathways involved in high-fat diet-induced hepatic insulin resistance. We used quantitative phosphoproteomics to map global in vivo changes in hepatic protein phosphorylation in chow-fed, high-fat-fed, and high-fat-fed with PKCε knockdown rats to distinguish the impact of lipid- and PKCε-induced protein phosphorylation. This was followed by a functional siRNA-based screen to determine which dynamically regulated phosphoproteins may be involved in canonical insulin signaling. Direct PKCε substrates were identified by motif analysis of phosphoproteomics data and validated using a large-scale in vitro kinase assay. These substrates included the p70S6K substrates RPS6 and IRS1, which suggested cross talk between PKCε and p70S6K in high-fat diet-induced hepatic insulin resistance. These results identify an expanded set of proteins through which PKCε may drive high-fat diet-induced hepatic insulin resistance that may direct new therapeutic approaches for T2D.
Keywords: PKCε; cross talk; insulin resistance; phosphoproteomics; systems biology.
Conflict of interest statement
The authors declare no conflict of interest.
Figures


Comment in
-
Role of PKCε in insulin resistance.Nat Rev Endocrinol. 2018 Nov;14(11):627. doi: 10.1038/s41574-018-0098-x. Nat Rev Endocrinol. 2018. PMID: 30242279 No abstract available.
Similar articles
-
Short-term overnutrition induces white adipose tissue insulin resistance through sn-1,2-diacylglycerol/PKCε/insulin receptor Thr1160 phosphorylation.JCI Insight. 2021 Feb 22;6(4):e139946. doi: 10.1172/jci.insight.139946. JCI Insight. 2021. PMID: 33411692 Free PMC article.
-
Insulin receptor Thr1160 phosphorylation mediates lipid-induced hepatic insulin resistance.J Clin Invest. 2016 Nov 1;126(11):4361-4371. doi: 10.1172/JCI86013. Epub 2016 Oct 17. J Clin Invest. 2016. PMID: 27760050 Free PMC article.
-
Proteomic analysis of livers from fat-fed mice deficient in either PKCδ or PKCε identifies Htatip2 as a regulator of lipid metabolism.Proteomics. 2014 Nov;14(21-22):2578-87. doi: 10.1002/pmic.201400202. Epub 2014 Oct 14. Proteomics. 2014. PMID: 25175814
-
Deconstructing the Role of PKC Epsilon in Glucose Homeostasis.Trends Endocrinol Metab. 2020 May;31(5):344-356. doi: 10.1016/j.tem.2020.01.016. Epub 2020 Feb 20. Trends Endocrinol Metab. 2020. PMID: 32305097 Review.
-
Nutritionally induced insulin resistance and receptor defect leading to beta-cell failure in animal models.Ann N Y Acad Sci. 1999 Nov 18;892:223-46. doi: 10.1111/j.1749-6632.1999.tb07798.x. Ann N Y Acad Sci. 1999. PMID: 10842665 Review.
Cited by
-
A Membrane-Bound Diacylglycerol Species Induces PKCϵ-Mediated Hepatic Insulin Resistance.Cell Metab. 2020 Oct 6;32(4):654-664.e5. doi: 10.1016/j.cmet.2020.08.001. Epub 2020 Sep 2. Cell Metab. 2020. PMID: 32882164 Free PMC article.
-
Bioactive lipids and metabolic syndrome-a symposium report.Ann N Y Acad Sci. 2022 May;1511(1):87-106. doi: 10.1111/nyas.14752. Epub 2022 Feb 25. Ann N Y Acad Sci. 2022. PMID: 35218041 Free PMC article.
-
The aetiology and molecular landscape of insulin resistance.Nat Rev Mol Cell Biol. 2021 Nov;22(11):751-771. doi: 10.1038/s41580-021-00390-6. Epub 2021 Jul 20. Nat Rev Mol Cell Biol. 2021. PMID: 34285405 Review.
-
Short-term overnutrition induces white adipose tissue insulin resistance through sn-1,2-diacylglycerol/PKCε/insulin receptor Thr1160 phosphorylation.JCI Insight. 2021 Feb 22;6(4):e139946. doi: 10.1172/jci.insight.139946. JCI Insight. 2021. PMID: 33411692 Free PMC article.
-
Association Between Ultraprocessed Food Consumption and Metabolic Disorders in Children and Adolescents with Obesity.Nutrients. 2024 Oct 17;16(20):3524. doi: 10.3390/nu16203524. Nutrients. 2024. PMID: 39458518 Free PMC article.
References
Publication types
MeSH terms
Substances
Grants and funding
LinkOut - more resources
Full Text Sources
Other Literature Sources
Medical
Miscellaneous

