. 2018 Oct 15;201(8):2452-2461.
doi: 10.4049/jimmunol.1800537. Epub 2018 Aug 31.

LFA-1 Ligation by High-Density ICAM-1 Is Sufficient To Activate IFN-γ Release by Innate T Lymphocytes

Affiliations

LFA-1 Ligation by High-Density ICAM-1 Is Sufficient To Activate IFN-γ Release by Innate T Lymphocytes

Akshat Sharma et al. J Immunol. .

Abstract

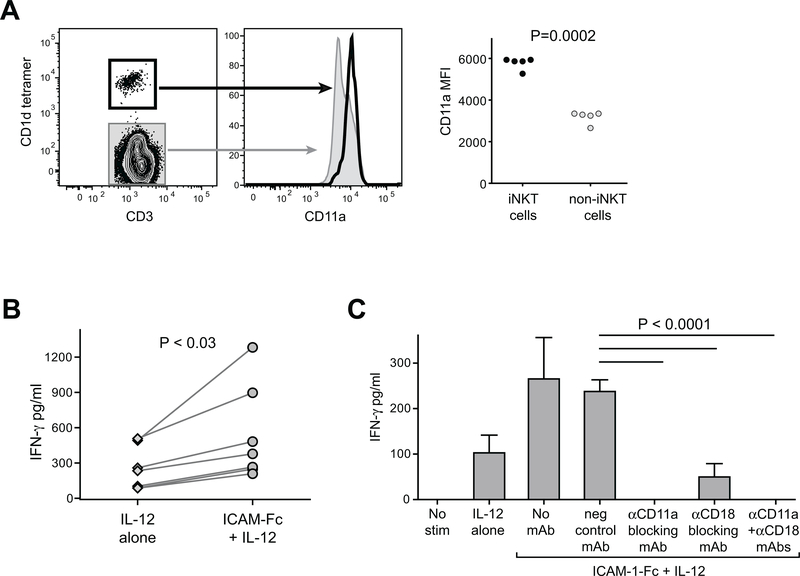
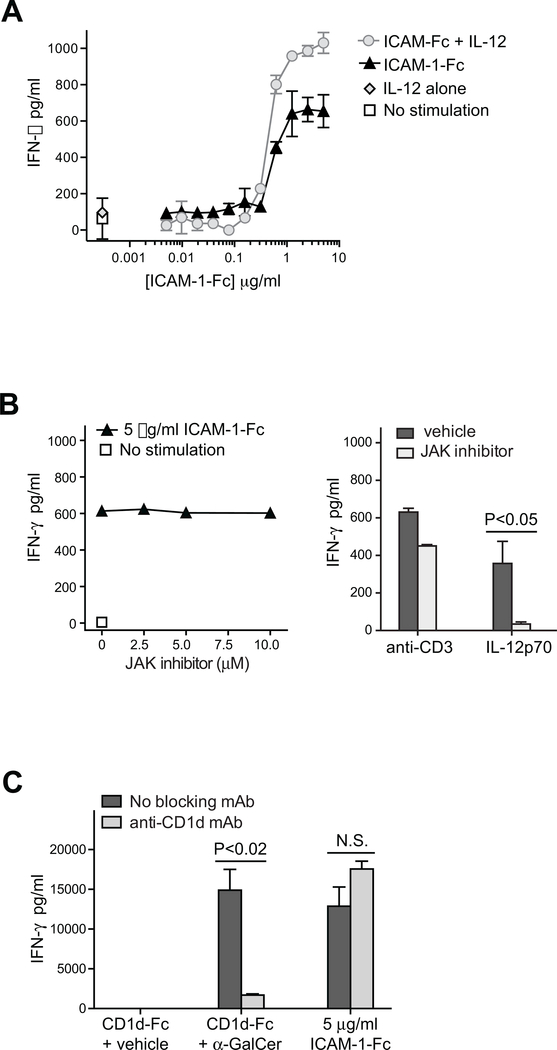
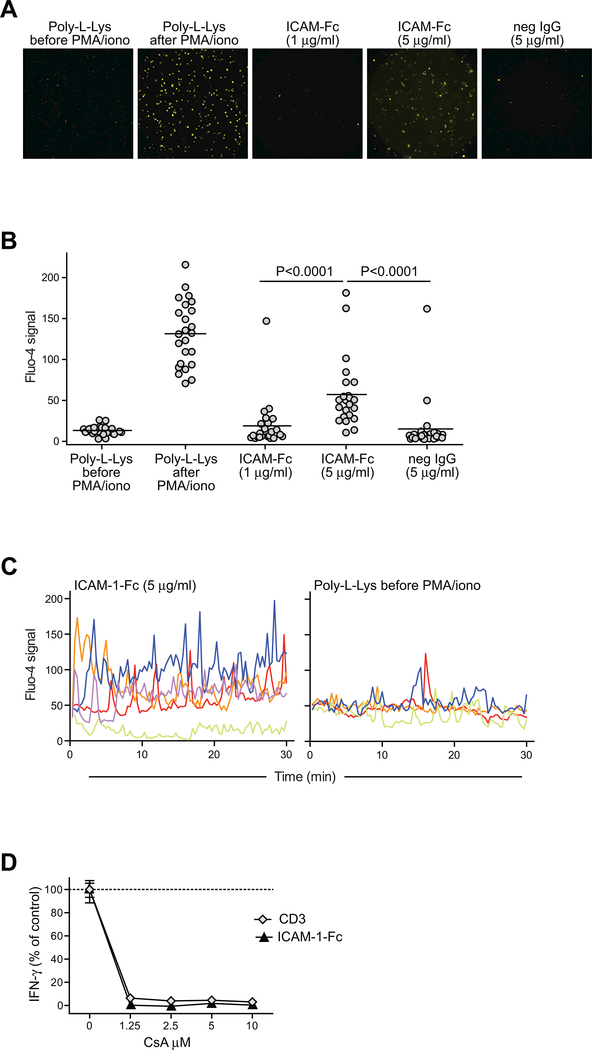
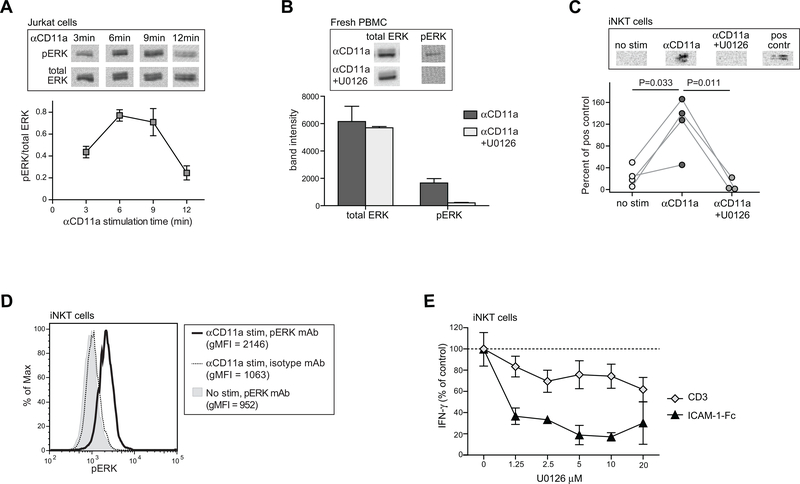
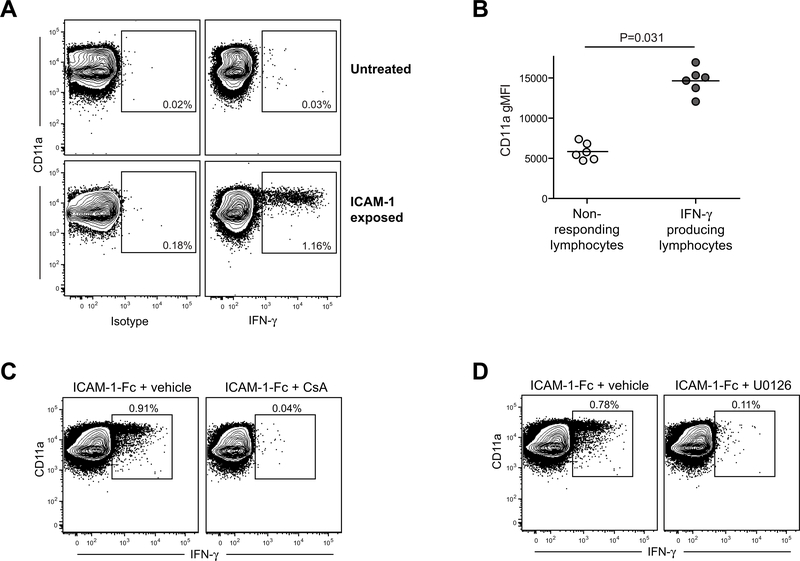
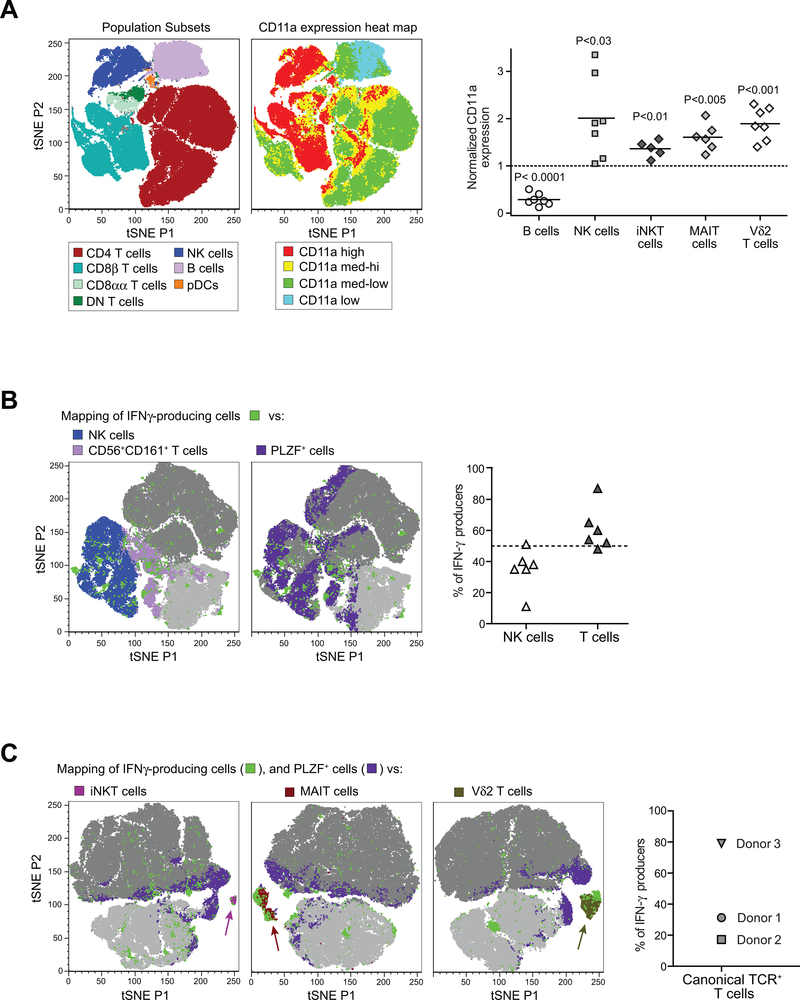
By binding to its ligand ICAM-1, LFA-1 is known to mediate both adhesion and costimulatory signaling for T cell activation. The constitutively high LFA-1 cell surface expression of invariant NKT (iNKT) cells has been shown to be responsible for their distinctive tissue homing and residency within ICAM-rich endothelial vessels. However, the functional impact of LFA-1 on the activation of iNKT cells and other innate T lymphocyte subsets has remained largely unexplored. In particular, it is not clear whether LFA-1 contributes to innate-like pathways of T cell activation, such as IFN-γ secretion in response to IL-12. Using a recombinant ICAM-1-Fc fusion protein to stimulate human iNKT cells in the absence of APCs, we show that LFA-1 engagement enhances their IL-12-driven IFN-γ production. Surprisingly, exposure to high densities of ICAM-1 was also sufficient to activate iNKT cell cytokine secretion independently of IL-12 and associated JAK/STAT signaling. LFA-1 engagement induced elevated cytoplasmic Ca2+ and rapid ERK phosphorylation in iNKT cells, and the resulting IFN-γ secretion was dependent on both of these pathways. Analysis of freshly isolated human PBMC samples revealed that a fraction of lymphocytes that showed elevated LFA-1 cell surface expression produced IFN-γ in response to plate-bound ICAM-1-Fc. A majority of the responding cells were T cells, with the remainder NK cells. The responding T cells included iNKT cells, MAIT cells, and Vδ2+ γδ T cells. These results delineate a novel integrin-mediated pathway of IFN-γ secretion that is a shared feature of innate lymphocytes.


Figures

Figure 1.
Figure 1.. Elevated LFA-1 expression on human iNKT cells co-stimulates IFN-γ secretion in response to IL-12p70.
A) Freshly isolated human PBMCs were stained with antibodies against CD3 and CD11a, and with α-GalCer loaded CD1d tetramer and analyzed by flow cytometry. Plots on left show CD11a expression by CD1d-tetramer positive (heavy black line) compared to tetramer-negative (grey shaded) for one representative experiment. Plot on right shows results from analysis of PBMC samples from five unrelated healthy adults. Mean fluorescence intensity (MFI) of CD11a staining is plotted for CD1d-tetramer positive (iNKT cells) and tetramer-negative (non-iNKT cells). B) iNKT cells were incubated for 24h in medium containing 20 U/ml recombinant human IL-12p70, in the presence of plate-bound ICAM-1-Fc (coated at 5 μg/ml) or negative control mAb (“IL-12 alone”). Secreted IFN-γ was quantitated using a standardized ELISA. The plot shows aggregated results from 7 independent experiments, using 5 different iNKT cell clonal lines (clones PP1.2, PP1.3, PP1.10, J3N.5, GG1.2). C) iNKT cells were incubated for 24h in culture medium alone (“no stim”), or in medium containing IL-12p70 in wells coated with a negative control mAb (“IL-12 alone”), or in medium containing IL-12p70 in wells coated with ICAM-1-Fc in the presence or absence of the indicated blocking antibodies, and secreted IFN-γ was quantitated by ELISA. The plot shows results from one representative experiment out of two using a short-term in vitro expansion of poly-clonal iNKT cells (318D line); bars indicate means and standard deviations from 4 replicates per treatment. Similar results were observed in an additional independent experiments (once with the 318D line, and once with iNKT clone PP1.2).
Figure 2.
Figure 2.. Exposure to a high density of ICAM-1 promotes iNKT cell IFN-γ secretion in a manner that is independent of IL-12 stimulation and CD1d recognition.
A) iNKT cells were incubated for 24h in wells coated with the indicated titrated doses of ICAM-1-Fc, in the presence or absence of 20 U/ml IL-12p70. Secreted IFN-γ was quantitated by ELISA. The plot shows results from one representative experiment out of two using a short-term in vitro expansion of poly-clonal iNKT cells (FoB line); symbols indicate means and standard deviations four replicates per treatment. Similar results were observed in an additional independent experiment using iNKT clones PP1.2. B) Left plot: iNKT cells (318D short-term polyclonal line) were incubated in wells coated with ICAM-1-Fc in the presence of the indicated concentrations of JAK2 inhibitor and secreted IFN-γ was quantitated by ELISA; similar results were obtained using a different polyclonal iNKT line (4LF). Right plot: iNKT cells (318D short-term polyclonal line) were exposed to plate-bound anti-CD3 mAb or cultured in medium containing IL-12p70, in the presence or absence of 10 μM JAK2 inhibitor. C) iNKT cells (318D short-term polyclonal line) were incubated in wells coated with CD1d-Fc fusion protein that had been pulsed with 25 ng/ml α-GalCer or vehicle, or in wells coated with 5 μg/ml ICAM-1-Fc. Where indicated, the CD1d- or ICAM-mediated iNKT cell stimulation was performed in the presence of an anti-CD1d blocking mAb.
Figure 3.
Figure 3.. Exposure to high density ICAM-1 induces Ca++ signaling in iNKT cells.
A-C) Cultured human iNKT cells (318D short-term polyclonal line) labeled with the calcium indicator dye Fluo-4 were placed on slides coated with the concentrations of ICAM-1-Fc, or with 5 μg/ml negative control immunoglobulin, or with poly-L-Lysine alone. Images were taken at 20 second intervals using a fluorescence microscope. Panel (A) shows a fluorescence microscopic image for each of the conditions. Panel (B) shows results from quantitation of the fluorescence signal for 24 randomly chosen cells per condition. Panel (C) shows the Fluo-4 signal intensities over time for individual iNKT cells (indicated by different color lines) placed on slides coated with 5 μg/ml ICAM or poly-L-lysine alone. D) iNKT cells were incubated for 24h with plate-bound ICAM-1-Fc (coated at 5 μg/ml), or with 0.5 μg/ml soluble anti-CD3 mAb, in the presence of the indicated concentrations of cyclosporin A (CsA), and secreted IFN-γ was quantitated by ELISA. The plot shows the amount of IFN-γ as a percentage of the amount produced in each condition in the absence of CsA; symbols represent the means and standard deviations (not always visible on the scale shown) of four replicates per condition. Similar results were obtained in four independent analyses.
Figure 4.
Figure 4.. iNKT cell IFN-γ secretion in response to LFA-1 stimulation is dependent on ERK phosphorylation.
A) Jurkat T cells were stimulated with anti-CD11a mAb for the indicated times, then lysed and subjected to Western blotting using detection antibodies against either total ERK or phospho-ERK. Images at the top show the phospho-ERK and corresponding total ERK results from a representative Western blot analysis; the plot below shows the means and standard deviations of the phospho-ERK signal normalized by the corresponding total ERK signal from three replicate Western blot analyses. B) Freshly isolated PBMCs were stimulated for 5 min with anti-CD11a in the presence or absence of 5 μM of the MEK inhibitor U0126. Images at the top show phospho-ERK and corresponding total ERK Western blot results. The plot below shows the band intensity (mean, std dev)from 3 independent analyses. C) Cultured iNKT cells (FoB short-term polyclonal line) were stimulated with anti-CD11a mAb for 5 minutes in the presence or absence of 5 μM U0126 and lysates were Western blotted to detect phospho-ERK. Positive control indicates Jurkat cells that were stimulated with 20nM 12-O-Tetradecanoyl-phorbol-13-acetate for 10 minutes. Plot below shows the aggregated results from 4 independent analyses, with band intensities for iNKT cell p-ERK normalized by the signal from the corresponding positive control band run in parallel. D) iNKT cells (318D short-term polyclonal line) were stimulated with anti-CD11a mAb for 5 minutes or mock-treated, then fixed and permeabilized, stained using an antibody against p-ERK or an isotype-matched negative control, and analyzed by flow cytometry. E) iNKT cells (FoB short-term polyclonal line) were incubated for 24h with plate-bound ICAM-1-Fc or with soluble anti-CD3 mAb, in the presence of the indicated concentrations of U0126, and secreted IFN-γ was quantitated by ELISA. The plot shows the amount of IFN-γ as a percentage of the amount produced in each condition in the absence of U0126; symbols represent the means and standard deviations (not always visible on the scale shown) of four replicates. Similar results were obtained in two additional independent analyses using the FoB polyclonal and PP1.3 clonal iNKT cell lines.
Figure 5.
Figure 5.. Exposure to high density ICAM-1 activates IFN-γ production by a small subset of human lymphocytes directly ex vivo.
A) Freshly isolated human PBMCs were incubated in culture wells coated with 5 μg/ml ICAM-1-Fc or with an isotype-matched negative control mAb, then subjected to flow cytometric analysis to assess CD11a expression levels and intracellular IFN-γ. Plots show results from analysis of the total lymphocyte gate as assessed by forward and side scatter. B) Aggregated results from analyses of PBMCs from six unrelated healthy adults, showing CD11a geometric mean fluorescence intensity (gMFI) for the lymphocyte population that stained positively for IFN-γ compared to those that did not. C and D) Freshly isolated human PBMCs were incubated in culture wells coated with 5 μg/ml ICAM-1-Fc in the presence of 5μM CsA (panel C) or 5μM U0126 (panel D), or vehicle alone, and then subjected to flow cytometric analysis to assess CD11a expression levels and intracellular IFN-γ.
Figure 6.
Figure 6.. NK cells and innate T cells produce IFN-γ directly ex vivo in response to high density ICAM-1.
Freshly isolated human PBMCs were incubated in wells coated with 5 μg/ml ICAM-1-Fc, then analyzed by flow cytometry to characterize the IFN-γ producing cells. A) Left plots: A freshly isolated PBMC sample was stained with antibodies against CD3, CD4, CD8α, CD8β, CD56, and CD11a, and analyzed by t-Distributed Stochastic Neighbor Embedding (tSNE) dimensionality reduction. Plot on left shows how lymphocyte subsets within the sample were clustered by the tSNE analysis. Neighboring plot shows the relative expression levels of CD11a for the cells included in the same tSNE analysis. Graph on far right shows the aggregated results from analysis of CD11a expression levels on the indicated lymphocyte subsets from PBMC samples of unrelated healthy adult donors. Each symbol represents the gMFI of the CD11a staining for the indicated cell type normalized by the CD11a gMFI of the total T cell population from the sam PBMC sample. B) Freshly isolated PBMC samples were exposed ex vivo to plate-bound ICAM-1-Fc, then stained with antibodies against CD3, CD8β, CD56, CD161, CD11a, and fixed and permeabilized and stained for intracellular IFN-γ and PLZF. Flow cytometric staining results from three independent PBMC samples were concatenated, and the CD11ahi lymphocytes were subjected to tSNE analysis. Far left plot shows the distribution of NK cells, CD56+CD161+ T cells and IFN-γ+ cells (light grey in background corresponds to CD8β+ T cells; dark grey corresponds to all other cells). Neighboring plot shows the distribution of PLZF+ and IFN-γ+ cells. Scatter plot on right shows the fraction of the IFN-γ producing subset identified as NK cells (CD56+CD3) vs. T cells (CD3+CD56) for PBMC samples from six unrelated healthy adults. C) Freshly isolated PBMC samples exposed to plate-bound ICAM-1, were stained for CD3, CD8β, CD161, CD11a, IFN-γ, PLZF, and either CD1d-tetramer, MR1-tetramer, or Vδ2 TCR. Results from three independent identically stained PBMC samples were concatenated, and the CD11ahi T cells were subjected to tSNE analysis. tSNE plots show the presence of IFN-γ+ cells in the iNKT (far left), MAIT (middle), and Vδ2+ T cell (right) subsets. Graph on far right shows the percent of the IFN-γ-producing population expressing these canonical TCRs for each of the PBMC donors that were included in the tSNE analyses.

Similar articles

Cited by

References

    1. Alonzo ES, and Sant’Angelo DB 2011. Development of PLZF-expressing innate T cells. Curr Opin Immunol 23: 220–227. - PMC - PubMed
    1. Constantinides MG, McDonald BD, Verhoef PA, and Bendelac A 2014. A committed precursor to innate lymphoid cells. Nature 508: 397–401. - PMC - PubMed
    1. Eidson M, Wahlstrom J, Beaulieu AM, Zaidi B, Carsons SE, Crow PK, Yuan J, Wolchok JD, Horsthemke B, Wieczorek D, and Sant’Angelo DB 2011. Altered development of NKT cells, gammadelta T cells, CD8 T cells and NK cells in a PLZF deficient patient. PLoS One 6: e24441. - PMC - PubMed
    1. Constantinides MG, and Bendelac A 2013. Transcriptional regulation of the NKT cell lineage. Cur. Opin. Immunol 25: 161–167. - PMC - PubMed
    1. Kovalovsky D, Uche OU, Eladad S, Hobbs RM, Yi W, Alonzo E, Chua K, Eidson M, Kim HJ, Im JS, Pandolfi PP, and Sant’Angelo DB 2008. The BTB-zinc finger transcriptional regulator PLZF controls the development of invariant natural killer T cell effector functions. Nat Immunol 9: 1055–1064. - PMC - PubMed

Publication types

Substances