. 2018 Nov 1;28(11):4049-4062.
doi: 10.1093/cercor/bhy198.

KCC2 Regulates Dendritic Spine Formation in a Brain-Region Specific and BDNF Dependent Manner

Affiliations

KCC2 Regulates Dendritic Spine Formation in a Brain-Region Specific and BDNF Dependent Manner

Patricia Nora Awad et al. Cereb Cortex. .

Abstract

KCC2 is the major chloride extruder in neurons. The spatiotemporal regulation of KCC2 expression orchestrates the developmental shift towards inhibitory GABAergic drive and the formation of glutamatergic synapses. Whether KCC2's role in synapse formation is similar in different brain regions is unknown. First, we found that KCC2 subcellular localization, but not overall KCC2 expression levels, differed between cortex and hippocampus during the first postnatal week. We performed site-specific in utero electroporation of KCC2 cDNA to target either hippocampal CA1 or somatosensory cortical pyramidal neurons. We found that a premature expression of KCC2 significantly decreased spine density in CA1 neurons, while it had the opposite effect in cortical neurons. These effects were cell autonomous, because single-cell biolistic overexpression of KCC2 in hippocampal and cortical organotypic cultures also induced a reduction and an increase of dendritic spine density, respectively. In addition, we found that the effects of its premature expression on spine density were dependent on BDNF levels. Finally, we showed that the effects of KCC2 on dendritic spine were dependent on its chloride transporter function in the hippocampus, contrary to what was observed in cortex. Altogether, these results demonstrate that KCC2 regulation of dendritic spine development, and its underlying mechanisms, are brain-region specific.


Figures

Figure 1.
Figure 1.
KCC2 localization in the plasmalemmal compartment of pyramidal cell somata occurs earlier in the hippocampus compared with the somatosensory cortex. (A) Western blot analysis of KCC2 monomer and dimer expression levels (monomer: 140KDa; dimer: >250KDa) in the hippocampus (H) and cortex (C) extracted from the same animals at different postnatal days (postnatal day 0—P0, P7, and P14). Blot shows representative samples of both regions from one animal per age. (B) Quantification reveals that KCC2 expression of the dimer (upper panel) and monomer (lower panel) are not significantly different between brain regions, but significantly increases with time (2-way Anova, KCC2 monomer: brain region, P = 0.0549; age, ***P < 0.0001; KCC2 dimer: brain region, P = 0.1342; age, ***P < 0.0001) P0: n = 5 rats, P7: n = 4 rats, P14: n = 4 rats. Circles represent individual sample values. Horizontal and vertical lines represent mean and SEM, respectively. (C) Western blot analysis of KCC2 in the membrane fractions prepared from the hippocampus (H) and cortex (C) extracted from the same animals at P7 and P20. Blot shows representative samples of both regions from 2 animals per age. (D) Quantification reveals that the expression of KCC2 dimer is significantly higher in the hippocampus than in somatosensory cortex at P7 (t-test *P = 0.0177), but not at P20 (t-test P = 0.6152). Note that we did not reliably detect KCC2 monomer in the membrane fractions. P7: n = 5 rats, P20: n = 6 rats. Circles represent individual sample values. (E) Confocal images of KCC2 immunostaining (green) at P7 and P20. Neuronal somata are labeled with anti-NeuN antibody (blue). By P7, KCC2 staining is clearly visible in the plasmalemmal compartment of CA1 (arrows), but not of cortical (arrowheads) pyramidal neurons. Scale bar, 10 μm. (F,G) Quantification of the percentage of NeuN+ cells showing KCC2 membrane immunostaining at P7 (F) and P20 (G) (t-test, P7: *P = 0 < 0.001; P20: P = 0.270).
Figure 2.
Figure 2.
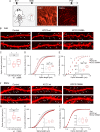
Premature expression of KCC2 in vivo decreases spine density in hippocampal neurons, but increases spine density in cortical pyramidal neurons. (A) Schematics of experimental procedure. (B) Representative basal dendrite segments from 2 different CA1 pyramidal cells showing that KCC2wt-expressing cells have fewer spines, while KCC2mut have longer and larger spines compared with control cells. Arrows indicate spines. Scale bar, 5 μm. (C) Spine density is significantly reduced in KCC2wt-expressing cells compared with control and KCC2 C568A-expressing ones (one-way Anova, *P = 0.0492). (D, E) Cumulative distribution and average (inset) spine length (D) and spine diameter (E). (D: one-way Anova *P = 0.0142; Kolmogorov–Smirnov (KS) test, Ctrl vs. KCC2wt *P = 0.0147; Ctrl vs. KCC2-C568A ***P < 0.0001; KCC2wt vs. KCC2-C568A ***P < 0.0001; E: one-way Anova, ***P < 0.0001; K–S test, Ctrl vs. KCC2-C568A **P = 0.0002; KCC2wt vs. KCC2-C568A **P = 0.0091). Pyramidal neurons: Ctrl, n = 8 from 5 animals, KCC2wt, n = 9 from 5 animals, KCC2-C568A, n = 5 from 3 animals. (F) Confocal images showing representative basal dendrite segments of pyramidal neurons from somatosensory cortex. (GI) Analysis of spine density (G), spine length (H), and spine diameter (I) of cortical pyramidal neurons reveals that KCC2wt premature expression increases spine density (one-way Anova, **P = 0.005), but neither spine length (one-way Anova, P = 0.193) or spine diameter were affected (one-way Anova, P = 0.921). Cumulative distribution of spine length shows slightly longer values in KCC2wt and KCC2 C568A transfected cells (KS test: Ctrl vs. KCC2wt **P = 0.0006; Ctrl vs. KCC2-C568A **P = 0.0006; KCC2wt vs. KCC2-C568A P > 0.99). Pyramidal neurons: Ctrl: n = 7 from 3 animals, KCC2wt: 8 from 5 animals, KCC2 C568A: 6 from 3 animals.
Figure 3.
Figure 3.
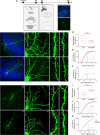
The effects of KCC2 premature expression on spine density are cell-autonomous. (A) Schematics of experimental procedure. (B,C) Low (B1,C1) and high (B2, C2) magnification of CA1 transfected pyramidal cells (NeuN immunostaining, blue). KCC2wt-expressing cells show fewer spines (3–4, arrowheads) compared with control cells (1–2, arrowheads). The 1–4 are from boxed regions in B2, C2. Scale bars B1–C1, 50 μm; B2–C2, 10 μm; b1/2–c3/4, 2 μm. (D) Spine density is strongly reduced in KCC2wt-overexpressing cells (t-test, *P = 0.0083). (E,F) Cumulative distribution and average (inset) spine length (E) and spine diameter (F) (E: t-test, P = 0.2248; K–S test, P = 0.4070; F: t-test, P = 0.5903; K–S test, P = 0.9957). n = 6 Ctrl pyramidal cells, n = 6 KCC2 wt pyramidal cells. (G,H) Low (G1,H1) and high (G2,H2) magnification of cortical pyramidal neurons. Spine density is increased in KCC2wt-overexpressing cells (compare dendrite segment in 3–4 with those in 1–2). Scale bars G1–H1, 50 μm; G2–H2, 10 μm; g1/2–h3/4, 2 μm. (I) Spine density (t-test, ***P < 0.0001). (J) Spine length (t-test, *P = 0.0238; K–S test, *P = 0.0116). (K) Spine diameter (t-test, P = 0.7203; K–S test, P = 0.3075). n = 7 Ctrl cells, n = 7 KCC2wt-transfected cells.
Figure 4.
Figure 4.
BDNF treatment blocks the spinogenesis promoting effect of KCC2 premature expression. (A) Western blot representative bands (top) and analysis (bottom) of BDNF protein levels in vivo reveal that BDNF expression is higher in the hippocampus than in the cortex during the first postnatal weeks (2-way Anova, age, ***P < 0.0001, brain region, ***P < 0.0001). Hippocampus: n = 5, 4, and 3 for P0, P7, and P14, respectively; Cortex: n = 5, 4, and 4 for P0, P7, and P14, respectively. N represents number of rats. (B) Western blot analysis of organotypic cultures shows that BDNF levels are higher in hippocampal than in cortical cultures during the first postnatal week in organotypic cultures (2-way Anova, age P = 0.0521, brain region **P = 0.0024). Hippocampus: n = 3, 4, and 4 for P8, P12, and P17, respectively; Cortex: n = 4, 4, and 3 for P8, P12, and P17, respectively. N represents samples, where each sample is obtained by pooling 3–4 cultured slices together. (C) Schematic of experimental procedure. (D) Representative basal dendrite segments of pCI-GFP transfected cortical pyramidal neurons, either untreated (Ctrl), or treated with BDNF (Ctrl + BDNF), and of pCI-GFP/KCC2wt transfected pyramidal neurons treated with BDNF (KCC2wt+BDNF). (E) Spine density analysis (one-way Anova, P = 0.0765). (F) Cumulative and average (inset) spine length analysis reveal that spines are longer after BDNF treatment, independently of KCC2 overexpression (one-way Anova, P = 0.0366; K–S test, Ctrl vs. Ctrl + BDNF **P = 0.0003, Ctrl vs. KCC2wt + BDNF P = 0.0707; Ctrl + BDNF vs. KCC2wt + BDNF *P = 0.0365). (G) Cumulative and average (inset) spine diameter analysis (one-way Anova, P = 0.1047; K–S test: Ctrl vs. Ctrl + BDNF *P = 0.0413; Ctrl vs. KCC2wt + BDNF P = 0.2877; Ctrl + BDNF vs. KCC2 wt + BDNF *P = 0.0164). N = 7 Ctrl cells; n = 9 ctrl+BDNF cells; n = 9 KCC2wt + BDNF cells.
Figure 5.
Figure 5.
BDNF treatment in organotypic cortical cultures increases KCC2 expression levels in the plasmalemmal compartment. (A, B) Example bands (A) and quantification (B) of western blot analysis of KCC2 expression in cortical organotypic cultures either untreated or treated with BDNF (monomer: t-test, P = 0.7829, dimer: Mann Whitney test P = 0.3929). n = 4 Ctrl and n = 4 BDNF-treated samples (4 organotypic cultures are pooled together for each sample). (C) Representative images of KCC2 immunostaining (green) and quantification (D) of cortical organotypic cultures either untreated (Ctrl) or treated with BDNF. Neuronal somata are immunostained with NeuN (blue). Scale bar, 50 μm; inset scale bar, 5 μm. t-test, *P = 0.0359; n = 66 neurons from N = 6 Ctrl slices, and n = 77 neurons from N = 7 BDNF-treated slices. Graphs represent mean ± SEM, with N of slices as independent replicates. (E) Example bands of western blot analysis of KCC2 expression in membrane fractions prepared from cortical organotypic cultures either untreated or treated with BDNF. Numbers (1,2) indicate cultures prepared from the same pup. (F) Quantification shows that BDNF treatment significantly increases membrane levels of KCC2 (paired t-test *P = 0.0143). N = 5 animals.
Figure 6.
Figure 6.
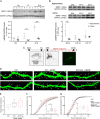
Transporter-dead KCC2 mutants are unable to induce spine loss in CA1 pyramidal neurons. (A) Confocal images of basal dendrites from 2 different pyramidal neurons per experimental groups, in utero electroporated with pCI-GFP alone or pCI-GFP together with C-terminal region of KCC2 (KCC2 CTD) or the N-terminal deleted KCC2 mutant (KCC2 ΔNTD). Scale bar, 5 μm. (B) Spine density is not significantly different between the 3 groups (one-way Anova, P = 0.8019). (C) Cumulative and average (inset) spine length show longer spines in KCC2 CTD transfected neurons (one-way Anova, *P = 0.0129; K–S test, Ctrl vs. KCC2 CTD P = 0.0707, Ctrl vs. KCC2 ΔNTD P = 0.07532, KCC2 CTD vs. KCC2 ΔNTD *P = 0.0234). (D) Cumulative and average (inset) spine diameter analysis reveal no significant difference between the 3 groups (one-way Anova, P = 0.1301; K–S test, Ctrl vs. KCC2 CTD P = 0.4401, Ctrl vs. KCC2 ΔNTD P = 0.9925; KCC2 CTD vs. KCC2 ΔNTD P = 0.2264). Ctrl: n = 7 pyramidal cells from 3 animals; KCC2 CTD: n = 9 pyramidal cells from 4 animals; KCC2 ΔNTD: n = 9 KCC2 NTD pyramidal cells from 4 animals.

Similar articles

Cited by

References

    1. Araya R, Vogels TP, Yuste R. 2014. Activity-dependent dendritic spine neck changes are correlated with synaptic strength. Proc Natl Acad Sci USA. 111:E2895–E2904. - PMC - PubMed
    1. Awad PN, Sanon NT, Chattopadhyaya B, Carrico JN, Ouardouz M, Gagne J, Duss S, Wolf D, Desgent S, Cancedda L, et al. . 2016. Reducing premature KCC2 expression rescues seizure susceptibility and spine morphology in atypical febrile seizures. Neurobiol Dis. 91:10–20. - PubMed
    1. Balakrishnan V, Becker M, Lohrke S, Nothwang HG, Guresir E, Friauf E. 2003. Expression and function of chloride transporters during development of inhibitory neurotransmission in the auditory brainstem. J Neurosci. 23:4134–4145. - PMC - PubMed
    1. Baldi R, Varga C, Tamas G. 2010. Differential distribution of KCC2 along the axo-somato-dendritic axis of hippocampal principal cells. Eur J Neurosci. 32:1319–1325. - PubMed
    1. Ben-Ari Y, Cherubini E, Corradetti R, Gaiarsa JL. 1989. Giant synaptic potentials in immature rat CA3 hippocampal neurones. J Physiol. 416:303–325. - PMC - PubMed

Publication types

MeSH terms

Grants and funding