Review
. 2018 Aug 31;361(6405):880-887.
doi: 10.1126/science.aau1044. Epub 2018 Aug 30.

Visualizing and discovering cellular structures with super-resolution microscopy

Affiliations
Review

Visualizing and discovering cellular structures with super-resolution microscopy

Yaron M Sigal et al. Science. .

Abstract

Super-resolution microscopy has overcome a long-held resolution barrier-the diffraction limit-in light microscopy and enabled visualization of previously invisible molecular details in biological systems. Since their conception, super-resolution imaging methods have continually evolved and can now be used to image cellular structures in three dimensions, multiple colors, and living systems with nanometer-scale resolution. These methods have been applied to answer questions involving the organization, interaction, stoichiometry, and dynamics of individual molecular building blocks and their integration into functional machineries in cells and tissues. In this Review, we provide an overview of super-resolution methods, their state-of-the-art capabilities, and their constantly expanding applications to biology, with a focus on the latter. We will also describe the current technical challenges and future advances anticipated in super-resolution imaging.


Conflict of interest statement

Competing interests: None declared.

Figures

Fig. 1.
Fig. 1.. Quantitative biological insights offered by super-resolution imaging.
Schematic of a cell together with three major application directions for super-resolution imaging. (A1–A9) Spatial organization and molecular interactions of cellular structures. (A1) STED images showing distinct distribution patterns of the envelope protein Env (red) in mature (left) and immature (right) HIV-1 particles attached to the cell, overlaid with the cell surface HIV-1 receptor CD4 (blue). Scale bar, 100 nm. Modified with permission from Ref. (49). (A2) PALM images showing the organization of ESCRT-I subunit Tsg101 (green) in a HIV assembly site marked by HIV Gag poteins (red) in lateral (top) and axial (bottom) views. Scale bar, 250 nm. Modified with permission from Ref. (50). (A3) 3D STORM images of a sperm-specific calcium channel (CatSper1) showing four linear domains along the sperm flagella. The z-position information is color-coded. Scale bars, 500 nm. Modified with permission from Ref. (51). (A4) PALM image on a bacterial cell showing the distribution of the ParA ATPase (green) with the ParB DNA binding protein (red) localized to the cell poles, for the coordination of chromosome segregation and cell division. Scale bar, 1 μm. Modified with permission from Ref. (52). (A5) Left: Overlay of PAINT (red) and diffraction-limited (gray) images of the ER obtained using lattice light-sheet microscopy. Right: PAINT image from the left panel, but color-coded by the z-position information. White arrowheads indicate areas that appear as sheets in diffraction-limited images but are resolved as connected tubular structures in super-resolution images. Scale bars, 2 μm. Modified with permission from Ref. (35). (A6) STED image of the pro-apoptotic cell-death mediator Bax (green) showing ring structures in apoptotic mitochondria marked by Tom22 (red). Scale bar, 500 nm. Modified from with permission Ref. (54). (A7) STORM image showing interactions between mitochondria (green) and purinosomes marked by the core protein FGAMS (magenta). Scale bar, 2 μm. Modified from with permission Ref. (56). (A8) Comparison of STORM images of telomeric DNA in mouse embryo fibroblasts in the presence (left) and absence (right) of the shelterin protein TRF2 that is required for t-loop formation. Scale bar, 1 μm. Modified with permission from Ref. (59). (A9) Top: Comparison of diffraction-limited (left) and 3D STORM (right) images for DNA in a chromatin domain in the nucleus of drosophila Kc167 cells. Scale bar, 500 nm. Bottom: Differential DNA compaction of transcriptionally active (red), inactive (gray) or polycomb-repressed (blue) epigenetic domains visualized using STORM. Scale bar, 250 nm. Modified with permission from Ref. (60). (B1–B3) Molecular counting and stoichiometric characterization. (B1) PALM images of proto-oncogene cRAF clusters on the cell plasma membrane, with (bottom) and without (top) coexpression of KRASG12D which induces cRAF clustering. Scale bar, 200 nm. Modified with permission from Ref. (66). (B2) 3D PALM image of molecular clusters with various sizes formed by a secretion system protein PrgH near the membrane of a bacterial cell. Scale bar, 500 nm. Modified with permission from Ref. (67). (B3) STORM images of endocytic vesicles displaying distinct vesicle size and PI3P content. The number of PI3P binding sites on each vesicle (n) is indicated. Scale bar, 100 nm. Modified with permission from Ref. (64). (C1–C4) Temporal dynamics. (C1) Durations (ttrap) for three lipid types, Phospho-ethanolamine (PE, grey), sphingomyelin (SM, red), sphingomyelin after cholesterol depletion (SM Coase, green), that are differentially trapped in ~20 nm nanodomains at the plasma membrane, which are detected and distingused by STED-FCS and confocal single-molecule tracking. Scale bar: 100 nm. Modified with permission from Ref. (69). (C2) Single particle tracking of a 30S ribosomal subunit protein in a bacterial cell using MINFLUX. Trajectories of individual molecules are shown in different colors. Scale bar, 500 nm. Modified with permission from Ref. (15). (C3) Time-lapsed STED images of a region of the somatosensory cortex of a living mouse with EYFP-labeled neurons showing dynamics of dendritic spines. Scale bar,1 μm. Modified with permission from Ref. (71). (C4) Time-lapsed STORM images showing fission (green arrowheads) and fusion (red arrowheads) events of mitochondria, with thin tubular structures connecting neighboring mitochondria as fission and fusion intermediates. Scale bar, 500nm. Modified with permission from Ref. (34).
Fig. 2
Fig. 2. The membrane-associated periodic skeleton (MPS) in neurons discovered by super-resolution imaging.
(A) Quasi one-dimensional (1D) periodic MPS observed in axons using STORM. Left: Comparison of diffraction-limited (top) and 3D-STORM (bottom) images of actin in axons. STORM image shows the periodic distribution of actin rings along the axon that is obscured by diffraction-limited imaging. Scale bar, 1 μm. Middle: Two color STORM images showing the periodic distributions of and spatial relationship between actin, spectrins (βII- and βIV-spectrin), and voltage gated sodium channels (Nav). Scale bar, 500 nm. Right: Schematic of the 1D MPS structure showing the organization of actin, spectrin tetramers, and adducin. Modified with permission from Ref. (47). (B) Top: Schematic of a node of Ranvier. Center: STED image showing the periodic distribution ankyrin-G (AnkG) on the 1D MPS structure at a node of Ranvier. Modified with permission from Ref. (74). Bottom: STED image showing the periodic distribution of the adhesion molecule Caspr on the 1D MPS structure observed flanking a node of Ranvier. Modified with permission from Ref. (76). Scale bars, 1 μm. (C) MPS structures observed in dendrites: Top-left: 1D MPS in a dendritic region observed by STORM imaging of βII-spectrin. Modified with permission from (72). Bottom-left: 1D MPS observed in a dendritic region by STED imaging of Actin. Modified with permission from Ref. (73). Right (top): 2D polygonal lattice-like arrangement of MPS components observed in a dendritic region by STORM imaging of actin. Right (bottom): A magnified region of the STORM image (left) and the corresponding 2D autocorrelation analysis (right) are shown. Modified with permission from Ref. (77). Scale bars, 1 μm. (D) 2D MPS observed on the soma of neuron by STORM imaging of βIII-spectrin (top-right) along with a 2D autocorrelation analysis of the boxed region (top-left). Bottom: Schematic of the 2D MPS structure. Scale bars, 200 nm. Modified with permission from Ref. (77).
Fig. 3
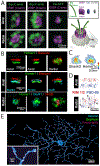
Fig. 3. Super-resolution imaging of synaptic structures.
(A) Left: 3D STED images of the presynaptic active zone including Bruchpilot (Brp) and Drosophila RIM binding protein (DRBP) as well as the voltage gated calcium channel Cacophony (Cac) at Drosophila neuromuscular junction synapses. Both axial (top) and radial (bottom) projections are shown. Scale bar, 200 nm. Right: Schematic of the active zone showing positions and orientations of components of the active zone cytomatrix including Brp, DRBP, and Cac in relation to the post-synaptic glutamate receptor (GluRIID) determined using STED. Modified with permission from Ref. (83). (B) Top: 3D STORM images of presynaptic protein Bassoon (red) and postsynaptic protein Homer (green). Two orthogonal axial views (left and middle) and the radial view (right) are shown. Scale bars, 200 nm. Center: Axial views of three synapses. In addition to Bassoon (red) and Homer1 (green), a third color (blue) was used to map the positions of additional postsynaptic (Shank1, left; GluR1, right) and presynaptic (Piccolo, middle) components at synapses. Bottom: Radial views of three example synapses showing differential abundance and spatial distribution of neurotransmitter receptors, NR2B and GluR1. Scale bars, 200 nm. Modified with permission from Ref. (84). (C) Radial projections of PALM images showing the clustered organization of postsynaptic proteins Shank3 (left) and Homer1c (right). Scale bar, 200 nm. Modified with permission from Ref. (85). (D) STORM and PALM images show that areas of higher protein density (darker colors) of both presynaptic (RIM1/2, red) and postsynaptic (PSD-95, blue) components are often trans-synaptically aligned to form “nanocolumns” (indicated by filled arrows). Both axial (top) and radial (bottom) projections are shown. Scale bar, 200 nm. Modified with permission from Ref. (87). (E) STORM maximum intensity projection of a retinal ganglion cell (blue) with associated synapses marked by postsynaptic scaffolding protein gephyrin (green) and presynaptic proteins (Bassoon, Piccolo, Munc13–1, and ELKS)(magenta), reconstructed from ultra-thin serial sections. Inset shows a zoomed in view of a region of dendrite. Scale bar, 10 μm, inset, 1 μm. Modified with permission from Ref. (38).
Fig. 4.
Fig. 4.. Super-resolution visualizing molecular complexes: Centriole-containing complexes and the nuclear pore complex.
(A) Single STED image (left) and particle-averaged STORM image (right) of the centriolar protein (CEP164), showing a radial 9-fold symmetry. Scale bars, 200 nm. Modified with permission from Ref. (89, 90). (B) Three centriolar and peri-centriolar proteins, Cent2, CEP152 and γ-Tubulin (TUBG1), imaged using SIM showing a concentric organization of the pericentriolar matrix. Scale bar, 1 μm. Modified with permission from Ref. (93). (C) Average distribution of C-terminus, central domain, and N-terminus of the pericentrin-like protein (PLP) demonstrating a radial, spoke-like orientation for PLP through the pericentriolar matrix as determined by SIM. Scale bar, 250 nm. Modified with permission from Ref. (94). (D) Single STORM image of the nucleoporin protein GP210 showing an 8-fold symmetry within the nuclear pore complex (NPC) of Xenopus oocytes. Scale bar, 150 nm. Modified with permission from Ref. (95). (E) Left: Radial distribution of several nucleoporins including Nup133, Nup107, Nup160 (C-terminus), Nup37, Nup160 (N-terminus), Seh1, and Nup85, that comprise the Y-shaped Nup107–160 complex determined using STORM and particle averaging. Right: A projection of the electron density of the cytoplasmic ring of the NPC determined by EM is overlaid with two possible arrangements of the Nup107–160 complex, determined by super-resolution imaging. Each protein is represented by a colored dot corresponding to the color and radius in the graph (left). Modified with permission from Ref. (96).

Similar articles

Cited by

References

    1. Hell SW, Wichmann J, Breaking the diffraction resolution limit by stimulated emission: stimulated-emission-depletion fluorescence microscopy. Optics letters 19, 780–782 (1994). - PubMed
    1. Klar TA, Hell SW, Subdiffraction resolution in far-field fluorescence microscopy. Optics letters 24, 954–956 (1999). - PubMed
    1. Hofmann M, Eggeling C, Jakobs S, Hell SW, Breaking the diffraction barrier in fluorescence microscopy at low light intensities by using reversibly photoswitchable proteins. Proceedings of the National Academy of Sciences of the United States of America 102, 17565–17569 (2005). - PMC - PubMed
    1. Eggeling C, Willig KI, Sahl SJ, Hell SW, Lens-based fluorescence nanoscopy. Quarterly reviews of biophysics 48, 178–243 (2015). - PubMed
    1. Heintzmann R, Gustafsson MGL, Subdiffraction resolution in continuous samples. Nature Photonics 3, 362–364 (2009).

Publication types

LinkOut - more resources