. 2018 Aug 15:9:1886.
doi: 10.3389/fimmu.2018.01886. eCollection 2018.

STAT3 Cooperates With Phospholipid Scramblase 2 to Suppress Type I Interferon Response

Affiliations

STAT3 Cooperates With Phospholipid Scramblase 2 to Suppress Type I Interferon Response

Ming-Hsun Tsai et al. Front Immunol. .

Abstract

Type I interferon (IFN-I) is a pluripotent cytokine that modulates innate and adaptive immunity. We have previously shown that STAT3 suppresses IFN-I response in a manner dependent on its N-terminal domain (NTD), but independent of its DNA-binding and transactivation ability. Using the yeast two-hybrid system, we have identified phospholipid scramblase 2 (PLSCR2) as a STAT3 NTD-binding partner and a suppressor of IFN-I response. Overexpression of PLSCR2 attenuates ISRE-driven reporter activity, which is further aggravated by co-expression of STAT3. Moreover, PLSCR2 deficiency enhances IFN-I-induced gene expression and antiviral activity without affecting the activation or nuclear translocation of STAT1 and STAT2 or the assembly of ISGF3 complex. Instead, PLSCR2 impedes promoter occupancy by ISGF3, an effect further intensified by the presence of STAT3. Moreover, palmitoylation of PLSCR2 is required for its binding to STAT3 and for this suppressive activity. In addition to STAT3, PLSCR2 also interacts with STAT2, which facilitates the suppressive effect on ISGF3-mediated transcriptional activity. Together, these results define the role of a novel STAT3-PLSCR2 axis in fine-tuning IFN-I response.

Keywords: IFN-stimulated gene; STAT3; palmitoylation; phospholipid scramblase 2; type I interferon.


Figures
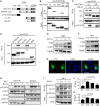
Figure 1
Figure 1
Phospholipid scramblase 2 (PLSCR2) is an IFN-inducible nuclear protein that interacts with the STAT3 N-terminal domain (NTD). (A) Schematic diagram of PLSCR2 full-length and truncated mutants. Abbreviations: PRD, proline-rich domain; DBD, DNA-binding domain; PAL, palmitoylation domain; NLS, nuclear localization signal; CBD, calcium-binding domain; TM, transmembrane domain. (B) HEK293T cells were transfected with HA-STAT3 NTD and myc-PLSCR2 (FL), PLSCR2109–307 (ΔN), PLSCR21–116 (NTD), PLSCR2171–307, or PLSCR2188–307, followed by co-IP with anti-HA antibody and immunoblotting with antibodies against myc and HA, respectively. Total lysates subjected to immunoblotting with anti-myc antibody were used as the input control. Blots are representative of two independent experiments. (C) HEK293T cells were transfected with HA-STAT3 (FL) or STAT3135–770 (ΔN) and myc-PLSCR2 and then treated with human IFN-α2 (1,000 U/ml) for 30 m, followed by co-IP assay as described in panel (B). Total lysates subjected to immunoblotting with anti-myc or pYSTAT3 antibody were used as the input control. Blots are representative of two independent experiments. (D) HEK293T cells were cotransfected with Myc-PLSCR2 and HA-tagged STAT3, STAT3135–770 (STAT3ΔN), STAT1, STAT2, or IRF9. The cell lysates were subjected to co-IP as in panel (B). Total lysates subjected to immunoblotting with antibodies against HA or Myc were used as the input control. Blots are representative of two independent experiments. (E,F) WT mouse embryonic fibroblast (MEF) (E) or ML-1 (F) cells were treated with mouse IFN-α4 (1,000 U/ml) for the indicated times. Total cell lysates were subjected to immunoblotting with antibodies against PLSCR2, STAT1, or tubulin. Blots are representative of two independent experiments. (G) WT MEFs were transfected with myc-PLSCR2 for 24 h, fixed, and then stained with anti-myc antibody and FITC-conjugated anti-mouse IgG and DAPI. Samples were visualized by confocal microscopy. Images are representative three independent experiments. Scale bar = 25 µm. (H) ML-1 cells were stimulated with mouse IFN-α4 (1,000 U/ml) for the indicated times. Cytosolic and nuclear extracts were subjected to immunoblotting with antibodies against PLSCR2, phospho-STAT3, STAT3, lamin B, or GAPDH. Blots are representative of two independent experiments. (I) ML-1 cells stimulated with mouse IFN-α4 (1,000 U/ml) for the indicated times were immunoprecipitated with anti-PLSCR2 antibody and immunoblotted with antibodies against pSTAT3 and STAT3. Total cell lysates subjected to immunoblotting with antibodies against pYSTAT3, STAT3, and PLSCR2 were used as the input control. Blots are representative of three independent experiments. (J,K) Quantification of co-immunoprecipitated pY-STAT3 (J) and STAT3 (K) with PLSCR2 was done by normalizing to input signals using ImageJ. Data are shown as mean ± SD, *p < 0.05, **p < 0.01.
Figure 2
Figure 2
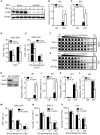
Phospholipid scramblase 2 (PLSCR2) suppresses IFN-induced IFN-stimulated gene (ISG) expression and antiviral responses. (A) WT mouse embryonic fibroblasts (MEFs) expressing luciferase- (shLuc) or PLSCR2-specific (shPLS2) shRNA were treated with or without IFN-α4 (1,000 U/ml) for the indicated times. Total cell lysates were subjected to immunoblotting with antibodies against PLSCR2 or tubulin. Blots are representative of two independent experiments. (B,C) Same as in panel (A), except cells were treated with IFN-α4 for 6 h and RNA was subjected to RT-QPCR using primers for Ifit1 (B), Ifit3 (C), and β-Actin. Relative mRNA was normalized to β-Actin (N = 3). (D) shLuc or shPLS2 transduced WT MEFs were infected with Sindbis virus (SINV)-GFP at an MOI of 1 or 10 for 20 h followed by flow cytometric analysis for GFP+ cells (N = 4). (E) Same as in panel (D), except the cells were pretreated with or without IFN-α4 (0.2 U/ml) for 24 h and then infected with SINV-GFP at an MOI of 1 (N = 4). (F,G) shLuc or shPLS2 transduced WT MEFs were pretreated with twofold serial dilution of IFN-α4 for 24 h before being infected with encephalomyocarditis virus (EMCV) (F) or vesicular stomatitis virus (VSV) (G) at an MOI of 1 for another 24 h. The viable cells were fixed and visualized with crystal violet. (H) Total cell lysates of WT and PLSCR2KO (PLS2KO) ML-1 cells were subjected to immunoblotting with antibodies against PLSCR2 or tubulin. (I,J) WT and PLS2KO ML-1 cells were treated with or without mouse IFN-α4 for 6 h. Total RNA was subjected to RT-QPCR using primers to Ifit1 (I), Ifit3 (J), and Rpl7. Relative mRNA was normalized to Rpl7 (N = 7). (K,L) Same as in panel (I), except PLS2KO ML-1 cells were transfected with empty vector (EV) or vector expressing PLSCR2 for 48 h (N = 3). (M) WT and PLS2KO ML-1 cells were treated with or without mouse IFN-α4 at 2.5 or 5 U/ml for 24 h and then infected with SINV-GFP at an MOI of 1 for 20 h followed by flow cytometric analysis for GFP+ cells (N = 3). (N,O) WT and PLS2KO ML-1 cells were pretreated with or without IFN-α4 at 10 or 100 U/ml for 24 h and then infected with EMCV (N) or VSV (O) at an MOI of 1 for 8 h. The viral titers were determined by plaque formation assay (N = 3). Data are shown as mean ± SD, *p < 0.05, **p < 0.01, and ***p < 0.001.
Figure 3
Figure 3
Phospholipid scramblase 2 (PLSCR2) deficiency enhances type I interferon (IFN-I)-induced antiviral and inflammatory gene signature. (A) Principal component analysis based on the gene expression profiles of WT and PLS2KO ML1 cells with or without IFN-α4 treatment for 6 h. (B,C) Venn diagram of shared upregulated genes (at least 2.0-fold changes and p < 0.05) in panel (B) WT (red) and PLS2KO (blue) cells following IFN-α4 6 h treatment vs. no treatment (ctrl), or in panel (C) no treatment (yellow) and IFN-α4 6 h treatment (green) in PLS2KO and WT cells. (D) Heatmap analysis of the upregulated IFN-stimulated genes (ISGs) in WT and PLS2KO cells. (E) Gene set enrichment analysis (GSEA) for IFN-α and inflammatory response genes. Abbreviations: NES, normalized enrichment score; FDR, false discovery rate. (F) Top upstream regulators analysis by ingenuity pathway analysis for IFN-I-treated WT vs. PLS2KO ML1 cells.
Figure 4
Figure 4
The suppressive effects of phospholipid scramblase 2 (PLSCR2) are STAT3 dependent. (A) ISRE-luc reporter plasmid was cotransfected with empty vector (EV) or vector expressing myc-PLSCR2 (PLS2) and/or HA-STAT3 and pEGFP-N1 in HEK293T cells for 24 h, followed by treatment with human IFN-α2 for 8 h. Total cell lysates were subjected to luciferase activity assay. Relative luciferase activity was normalized to the GFP+ percentage (N = 3). (B) Same as in panel (A), except ISRE-luc was cotransfected with full length (FL) or different truncated mutants of PLSCR2 and pEGFP-N1 in HEK293T cells. Fold changes were normalized to EV control (N = 7). (C) WT and PLS2KO ML-1 cells were stably transduced with lentivirus expressing shLuc or shSTAT3. Total cell lysates were subjected to immunoblotting with antibodies against STAT3, PLSCR2, and tubulin. Blots are representative of two independent experiments. (D,E) WT or PLS2KO ML-1 cells stably transduced with shLuc or shSTAT3 were stimulated with mouse IFN-α4 for 6 h. Total RNA was subjected to RT-QPCR using primers to Ifit1 (D), Ifit3 (E), and Rpl7. Relative mRNA was normalized to Rpl7 (N = 3). (F) WT and STAT3KO mouse embryonic fibroblasts (MEFs) were stably transduced with lentivirus expressing shLuc or shPLS2. Total cell lysates were subjected to immunoblotting as in panel (C). (G,H) Same as in panels (D,E), except WT or STAT3KO MEFs stably transduced with shLuc or shPLS2 were used (N = 3). Data are shown as mean ± SD, *p < 0.05, **p < 0.01, and ***p < 0.001.
Figure 5
Figure 5
Palmitoylation of phospholipid scramblase 2 (PLSCR2) is required for interaction with STAT3 and for its suppressive effects. (A) Schematic diagram of WT and CA mutant of PLSCR2. Four conserved cysteine residues (CCFPCC) in the palmitoylation motif were changed to alanine residues. (B) HEK293T cells were transfected with empty vector (EV), myc-tagged WT, or CA mutant of PLSCR2 for 48 h and were subjected to palmitoylation assay as described in Section “Materials and Methods.” Total cell lysates were subjected to blotting with SAV-horseradish peroxidase or anti-myc antibody. Blots are representative of two independent experiments. (C) HEK293T cells were cotransfected with HA-tagged ΔN or full length (FL) STAT3 and myc-tagged WT, or CA mutant of PLSCR2. Co-IP assays were performed with anti-HA antibody followed by immunoblotting with antibodies against HA or myc. Immunoblotting of total cell lysates was used as input control. Blots are representative of two independent experiments. (D,E) PLS2KO ML-1 cells were transfected with EV, WT, or the CA mutant of PLSCR2 for 48 h. The transfected cells were treated with mouse IFN-α4 for 6 h. Total RNA of the treated cells was subjected to RT-QPCR using primers to Ifit1 (D), Ifit3 (E), and Rpl7. Relative mRNA was normalized to Rpl7 (N = 3). (F) Same as in panels (D,E) except the transfected cells were infected with Sindbis virus (SINV)-GFP at an MOI of 10 for 20 h, followed by flow cytometric analysis for GFP+ cells (N = 4). Data are shown as mean ± SD, *p < 0.05, **p < 0.01, and ***p < 0.001.
Figure 6
Figure 6
Phospholipid scramblase 2 (PLSCR2) suppresses the recruitment of ISGF3 to IFN-stimulated gene (ISG) promoters. (A) WT and PLS2KO ML-1 cells were treated with IFN-α4 for the indicated times. Nuclear extracts were subjected to immunoblotting with antibodies against pYSTAT1, STAT1, pYSTAT2, STAT2, pYSTAT3, STAT3, PLSCR2, or lamin B. Blots are representative of three independent experiments. (B) Same as in panel (A), except nuclear extracts were subjected to co-IP using antibodies against STAT1 or STAT2, followed by immunoblotting with antibody to pYSTAT2 or pYSTAT1, STAT2, and STAT1. Total cell extracts were subjected to immunoblotting using the indicated antibodies for input control. Blots are representative of two independent experiments. (C,D) WT and PLS2KO ML-1 cells were treated with IFN-α4 for 3 h, followed by chromatin immunoprecipitation with antibody to control Ig (Ctrl) or STAT1 and then subjected to Q-PCR using primers to ISRE of the promoter of Ifit1 (C) or Ifit3 (D). Relative abundance was normalized to input (N = 3). (E) WT and PLS2KO ML-1 cells were stimulated with or without IFN-α4 for the indicated times. Nuclear extracts of the treated cells were subjected to electrophoretic mobility shift assay (EMSA) as described in Section “Materials and Methods.” Blots are representative of two independent experiments. (F) HEK293T cells were transfected individually with empty vector (EV), HA-tagged STAT3, myc-tagged WT or CA mutant of PLS2 or cotransfected with human STAT1, STAT2, and IRF9 for 48 h and then treated with or without IFN-α2 for 60 m. The nuclear lysates were added together in vitro as indicated before EMSA. For the supershift assay, anti-STAT1 or anti-IRF9 antibodies were added to the mixture. Blots are representative of two independent experiments. Data are shown as mean ± SD, **p < 0.01, and ***p < 0.001.
Figure 7
Figure 7
The suppressive effect of phospholipid scramblase 2 (PLSCR2) is also STAT2-dependent. (A) WT and PLS2KO ML-1 cells were stably transduced with shLuc or shSTAT2. Total cell lysates were subjected to immunoblotting with antibodies against STAT2, PLSCR2, or tubulin. (B,C) WT or PLS2KO ML-1 cells stably transduced with shLuc or shSTAT2 were stimulated with or without IFN-α4 for 6 h. Total RNA was subjected to RT-QPCR using primers to Ifit1 (B), Ifit3 (C), and Rpl7. Relative mRNA was normalized to Rpl7 (N = 3). Data are shown as mean ± SD. *p < 0.05. (D) A model of fine tuning of type I interferon (IFN-I) response by the STAT3–PLSCR2 axis. The binding of IFN-I to IFN receptor activates STAT1, STAT2, and STAT3. Activated STAT1 and STAT2 form ISGF3 complex with IRF9, translocate into the nucleus, bind the promoters, and transactivate downstream IFN-stimulated genes (ISGs) resulting in an antiviral response. One of the ISGs is PLSCR2, which interacts with the N-terminal domain (NTD) of phosphorylated or unphosphorylated STAT3 through its palmitoylation motif. The STAT3–PLSCR2 complex impedes the recruitment of ISGF3 to the promoters, probably in a STAT2-dependent manner, thus suppressing IFN-induced ISGs and the antiviral response.

Similar articles

Cited by

References

    1. Bowie AG, Unterholzner L. Viral evasion and subversion of pattern-recognition receptor signalling. Nat Rev Immunol (2008) 8(12):911–22.10.1038/nri2436 - DOI - PMC - PubMed
    1. Platanias LC. Mechanisms of type-I- and type-II-interferon-mediated signalling. Nat Rev Immunol (2005) 5(5):375–86.10.1038/nri1604 - DOI - PubMed
    1. Ho HH, Ivashkiv LB. Role of STAT3 in type I interferon responses. Negative regulation of STAT1-dependent inflammatory gene activation. J Biol Chem (2006) 281(20):14111–8.10.1074/jbc.M511797200 - DOI - PubMed
    1. Wang WB, Levy DE, Lee CK. STAT3 negatively regulates type I IFN-mediated antiviral response. J Immunol (2011) 187(5):2578–85.10.4049/jimmunol.1004128 - DOI - PubMed
    1. Zhang X, Darnell JE, Jr. Functional importance of Stat3 tetramerization in activation of the alpha 2-macroglobulin gene. J Biol Chem (2001) 276(36):33576–81.10.1074/jbc.M104978200 - DOI - PubMed

Publication types

MeSH terms