. 2018 Oct;28(10):1520-1531.
doi: 10.1101/gr.231886.117. Epub 2018 Aug 29.

A massively parallel reporter assay reveals context-dependent activity of homeodomain binding sites in vivo

Affiliations

A massively parallel reporter assay reveals context-dependent activity of homeodomain binding sites in vivo

Andrew E O Hughes et al. Genome Res. 2018 Oct.

Abstract

Cone-rod homeobox (CRX) is a paired-like homeodomain transcription factor (TF) and a master regulator of photoreceptor development in vertebrates. The in vitro DNA binding preferences of CRX have been described in detail, but the degree to which in vitro binding affinity is correlated with in vivo enhancer activity is not known. In addition, paired-class homeodomain TFs can bind DNA cooperatively as both homodimers and heterodimers at inverted TAAT half-sites separated by 2 or 3 nucleotides. This dimeric configuration is thought to mediate target specificity, but whether monomeric and dimeric sites encode distinct levels of activity is not known. Here, we used a massively parallel reporter assay to determine how local sequence context shapes the regulatory activity of CRX binding sites in mouse photoreceptors. We assayed inactivating mutations in more than 1700 TF binding sites and found that dimeric CRX binding sites act as stronger enhancers than monomeric CRX binding sites. Furthermore, the activity of dimeric half-sites is cooperative, dependent on a strict 3-bp spacing, and tuned by the identity of the spacer nucleotides. Saturating single-nucleotide mutagenesis of 195 CRX binding sites showed that, on average, changes in TF binding site affinity are correlated with changes in regulatory activity, but this relationship is obscured when considering mutations across multiple cis-regulatory elements (CREs). Taken together, these results demonstrate that the activity of CRX binding sites is highly dependent on sequence context, providing insight into photoreceptor gene regulation and illustrating functional principles of homeodomain binding sites that may be conserved in other cell types.


Figures

Figure 1.
Figure 1.
Primary sequence features predict CRX occupancy in vivo. (A) Schematic of analytical approach. We selected 5250 CRX-bound regions and 52,500 CRX-unbound regions based on CRX ChIP-seq data (200-bp elements centered on peak summits). Feature vectors composed of average dinucleotide frequencies and/or counts of specific TF binding sites (up to 206) were defined for each sequence. (B) CRX ChIP-seq peaks are centered on local enrichments of specific dinucleotide classes, including elevated GC and AG dinucleotide content. CRX-unbound regions are also modestly enriched for specific dinucleotide classes, likely due to selecting regions with GC content matching that of CRX-bound regions. (C) CRX ChIP-seq peaks are centered on local enrichments of specific TF binding sites, including monomeric and dimeric CRX binding sites. (D) Performance of specific models classifying CRX-bound versus CRX-unbound sequences visualized with ROC (FPR vs. TPR) and PR (recall vs. precision) curves. (TPR) True-positive rate; (FPR) false-positive rate; (dashed lines) performance of random classifiers; (LR) logistic regression. LR: Best PWM indicates counts of dimeric CRX binding sites (single PWM; AUC-ROC = 0.77, AUC-PR = 0.26). LR: Full model indicates dinucleotide frequencies and counts of 206 TF binding sites (binned by PWM score; AUC-ROC = 0.95, AUC-PR = 0.74). For feature weights, see Supplemental Table 2. gkm-SVM indicates 11-mers with seven informative positions (AUC-ROC = 0.99, AUC-PR = 0.92). (E) Performance of LR: full model with features extracted from windows of different sizes (20 bp to 200 bp). Gray box indicates maximum AUC.
Figure 2.
Figure 2.
Primary sequence features are correlated with CRE activity in vivo. (A) Schematic of experimental approach: 100-bp elements centered on CRX ChIP-seq peaks were cloned upstream of a photoreceptor promoter driving DsRed with CRE-specific barcodes. Constructs were electroporated into P0 mouse retina and cultured for 8 d, at which point RNA and DNA were harvested and barcodes were amplified and sequenced to quantify activity. (B) Distribution of activity of elements assayed on either pRho or pCrx. Data are median-centered. (Dashed lines) Threefold decrease or increase relative to median. The percentage of constructs with activity above or below this threshold is indicated. (C) Correlation between number of E-Box binding sites and activity on pRho and pCrx. (D) Heatmap of Pearson correlation coefficients (PCCs) between specific dinucleotide frequencies or counts of TF binding sites and activity. Included features were significantly correlated with activity on at least one promoter. (E) Heatmap of Pearson correlations between genomic and epigenomic data sets and CRE activity. (F) Performance of specific models classifying elements with low (within 1.2-fold of the median) versus high (greater than threefold above the median) activity on pCrx. LogR (CRX ChIP) indicates logistic regression classifier using scores from logistic regression model trained on CRX ChIP-seq data (AUC-ROC = 0.71) (for full model, see Fig. 1D). SVM (CRX ChIP) indicates logistic regression classifier using scores from gkm-SVM classifier trained on CRX ChIP-seq data (AUC-ROC = 0.74). SVM (combined) indicates logistic regression classifier using scores from gkm-SVM models trained on genomic and epigenomic data sets listed in Supplemental Table 3 (AUC-ROC = 0.80). (Dashed line) Performance of a random classifier.
Figure 3.
Figure 3.
Dimeric CRX sites have higher activity than monomeric CRX sites. (A, top) Heatmaps of nucleotide content in a 30-bp window centered on monomeric or dimeric CRX binding sites. Rows correspond to distinct TF binding sites, columns correspond to distinct positions, and tiles are colored by nucleotide identity. (Bottom) Average conservation (100-way vertebrate phyloP scores) at each position. Positions 0–3 (and 7–10 for dimeric TF binding sites) correspond to TAAT cores (gray boxes). (B) Schematic of experimental approach. The effects of single–base pair substitutions (TAAT to TACT) in 1756 CRX binding sites within CRX ChIP-seq peaks were quantified by CRE-seq. (C) Distribution of mutation effects (log2 fold change). (D) Volcano plot of mutation effects. Among mutations that significantly change activity (FDR < 0.05), 85% decrease activity and 15% increase activity. (Red) Significant decrease in activity; (blue) significant increase in activity; and (gray) change in activity not significant. (E) Absolute effect size versus monomeric or dimeric PWM score (binned by match P-value). (F, left) Activity distributions of CREs with two monomeric CRX binding sites when neither, one, or both are mutated. (Right) Activity distributions of CREs with dimeric CRX binding sites when neither, one, or both half-sites are mutated.
Figure 4.
Figure 4.
Dense mutagenesis of monomeric and dimeric CRX binding sites. (A) Schematic of experimental approach. All single-nucleotide substitutions in a 13-bp window overlapping 97 monomeric and 98 dimeric CRX binding sites were quantified by CRE-seq (n = 39 mutations per TF binding site). (B) Heatmaps of median effects (across all three substitutions) at each position (columns) in each targeted CRX binding site (rows). Each heatmap represents 97 or 98 distinct elements, and rows are sorted by wild-type activity (high to low). (C) Heatmaps of median effects (across all target sites) at each position (columns) for specific substitutions (rows). (Top) Change in CRX binding site affinity determined by quantitative gel shift for all possible substitutions in a single target sequence (Lee et al. 2010). (Middle) Change in activity determined by CRE-seq for substitutions in 97 monomeric CRX binding sites. (Bottom) Change in activity determined by CRE-seq for substitutions in 98 dimeric CRX binding sites. (D, top) Scatter plot of median effects (for all three substitutions; y-axis) at each position (x-axis) in each targeted CRX binding site. Points represent different targeted CRX binding sites, and horizontal bars represent the median across all targets. (Bottom) Average conservation scores (phyloP) at each position (same data as in Fig. 3A).
Figure 5.
Figure 5.
The activity of dimeric CRX binding sites depends on half-site spacing. (A, left) Schematic of experimental approach. The effect of all 1-, 2-, and 3-bp spacer deletions in 195 CRX binding sites were quantified by CRE-seq. (Right) Scatter plot of mutation effects. Points represent individual mutations, and horizontal bars represent the median across all targets for deletions of the indicated size. (B, left) Schematic of experimental approach. The effect of specific 1-, 2-, and 3-bp spacer insertions in 195 CRX binding sites were quantified by CRE-seq. (Right) Scatter plot of mutation effects. Points represent individual mutations, and horizontal bars represent the median across all targets for insertions of the indicated size. In A and B, P-values are reported for Mann-Whitney U tests comparing the distributions of effects between mutations in monomeric versus dimeric CRX binding sites. (C, left) Schematic of experimental approach. The effects of selected 3-bp spacer substitutions in 98 dimeric CRX binding sites were quantified by CRE-seq. (Right) Scatter plot of mutation effects. Points represent individual mutations, and horizontal bars represent the median across all targets for the indicated substitution. The included heatmap shows counts of the indicated K50 and Q50 motifs among binding sites with each spacer substitution.
Figure 6.
Figure 6.
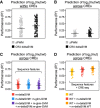
Accounting for baseline CRE activity improves the prediction of variant effects. (A) Performance (R2) of simple linear regression predicting the effect of individual substitutions from changes in PWM scores or CRX ChIP-seq deltaSVM scores, fitting separate models for each CRE. (B) Same as in A, except fitting a single model for all CREs. (C) Performance of multiple linear regression predicting the effect of individual substitutions using deltaSVM scores from multiple data sets (m-deltaSVM), m-deltaSVM and the corresponding gkm-SVM scores from multiple data sets (m-gkm-SVM), or m-deltaSVM scores and m-gkm-SVM scores including all pairwise interactions. (D) Performance of multiple linear regression predicting mutant expression using wild-type (WT) expression, WT expression and m-deltaSVM scores, or WT expression, m-deltaSVM scores, and interactions between WT expression and deltaSVM scores. In A, individual points represent the performance of models fit for different CREs (n = 195). In BD, individual points represent the performance of models estimated from different folds of repeated 10-fold cross-validation (n = 100).

Similar articles

Cited by

References

    1. Abrahams A, Parker MI, Prince S. 2010. The T-box transcription factor Tbx2: its role in development and possible implication in cancer. IUBMB Life 62: 92–102. - PubMed
    1. Alvarez-Delfin K, Morris AC, Snelson CD, Gamse JT, Gupta T, Marlow FL, Mullins MC, Burgess HA, Granato M, Fadool JM. 2009. Tbx2b is required for ultraviolet photoreceptor cell specification during zebrafish retinal development. Proc Natl Acad Sci 106: 2023–2028. - PMC - PubMed
    1. Arnold CD, Gerlach D, Stelzer C, Boryn LM, Rath M, Stark A. 2013. Genome-wide quantitative enhancer activity maps identified by STARR-seq. Science 339: 1074–1077. - PubMed
    1. Badis G, Berger MF, Philippakis AA, Talukder S, Gehrke AR, Jaeger SA, Chan ET, Metzler G, Vedenko A, Chen X, et al. 2009. Diversity and complexity in DNA recognition by transcription factors. Science 324: 1720–1723. - PMC - PubMed
    1. Barrera LA, Vedenko A, Kurland JV, Rogers JM, Gisselbrecht SS, Rossin EJ, Woodard J, Mariani L, Kock KH, Inukai S, et al. 2016. Survey of variation in human transcription factors reveals prevalent DNA binding changes. Science 351: 1450–1454. - PMC - PubMed

Publication types