

Rapamycin rescues BMP mediated midline craniosynostosis phenotype through reduction of mTOR signaling in a mouse model
- PMID: 30134066
- PMCID: PMC6108447
- DOI: 10.1002/dvg.23220
Rapamycin rescues BMP mediated midline craniosynostosis phenotype through reduction of mTOR signaling in a mouse model
Erratum in
-
Erratum.Genesis. 2022 Jul;60(6-7):e23489. doi: 10.1002/dvg.23489. Epub 2022 Jun 20. Genesis. 2022. PMID: 35723232 No abstract available.
Abstract
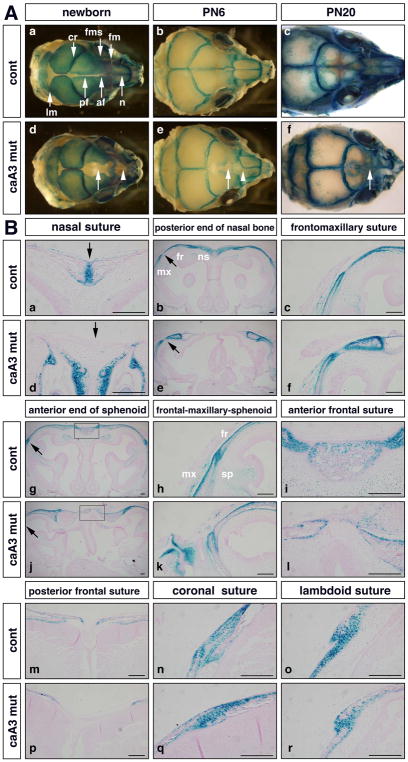
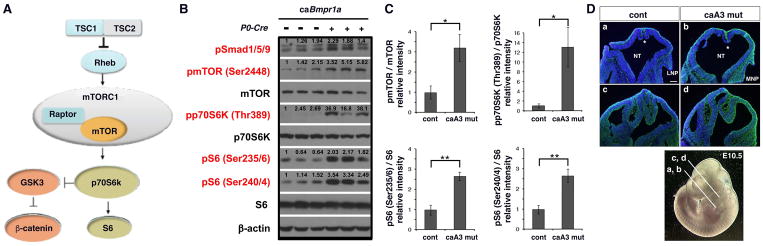
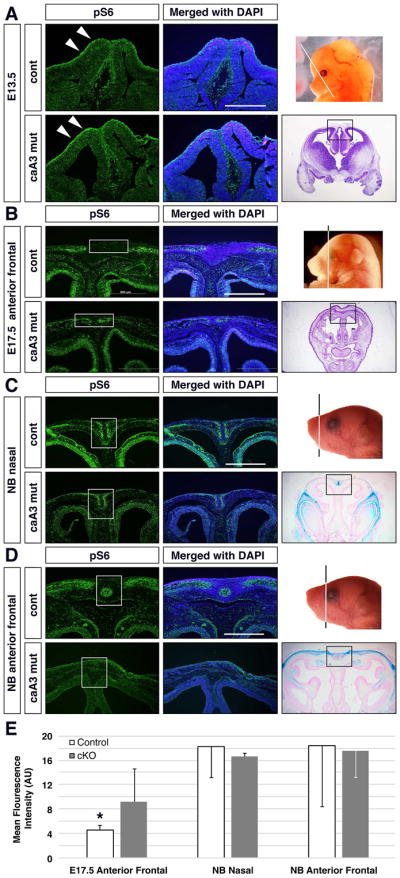
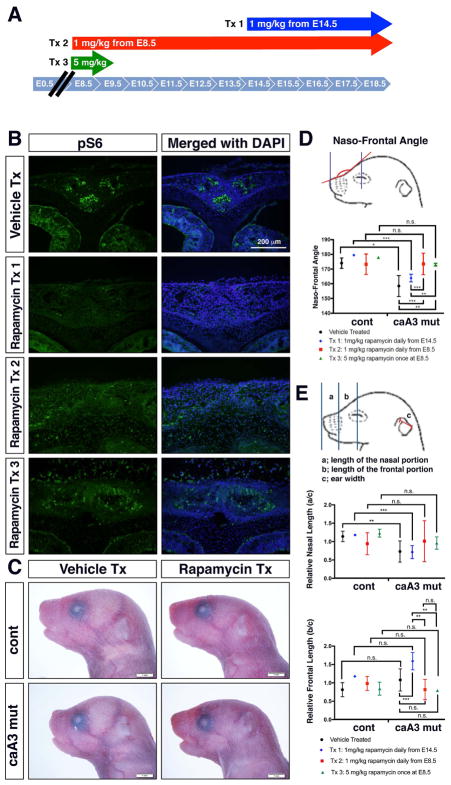
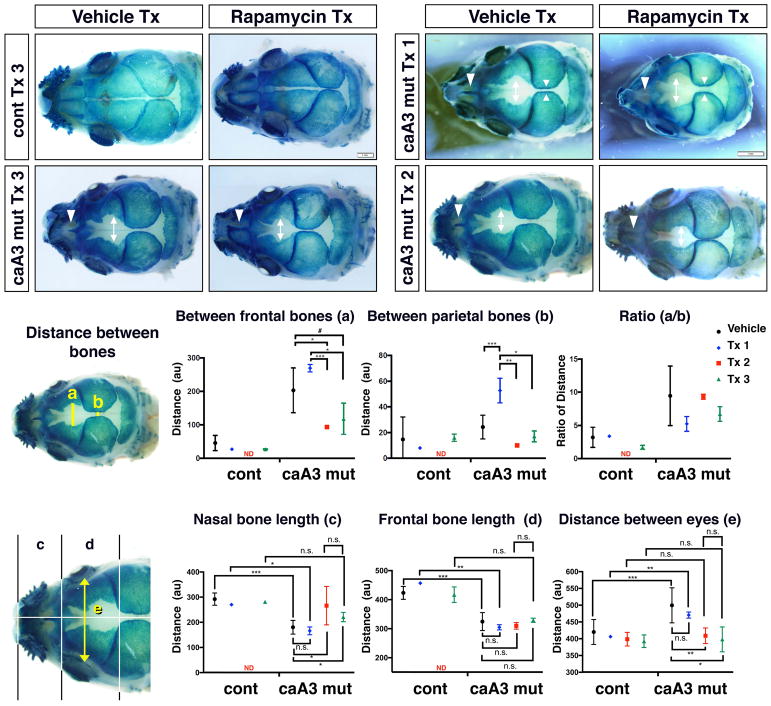
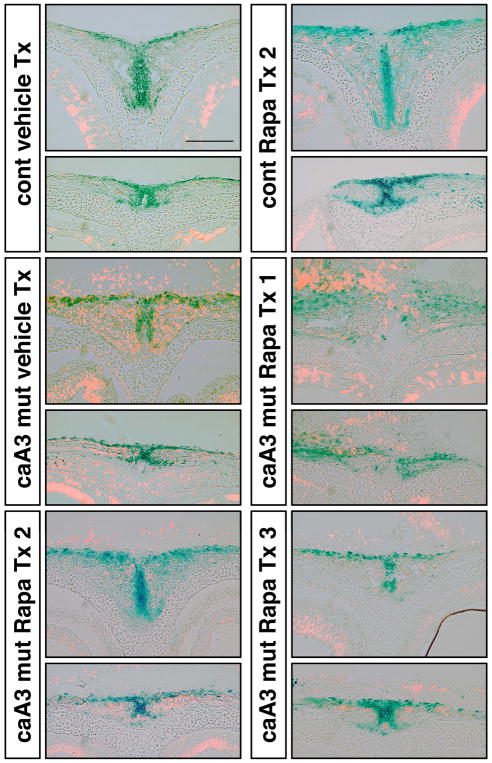
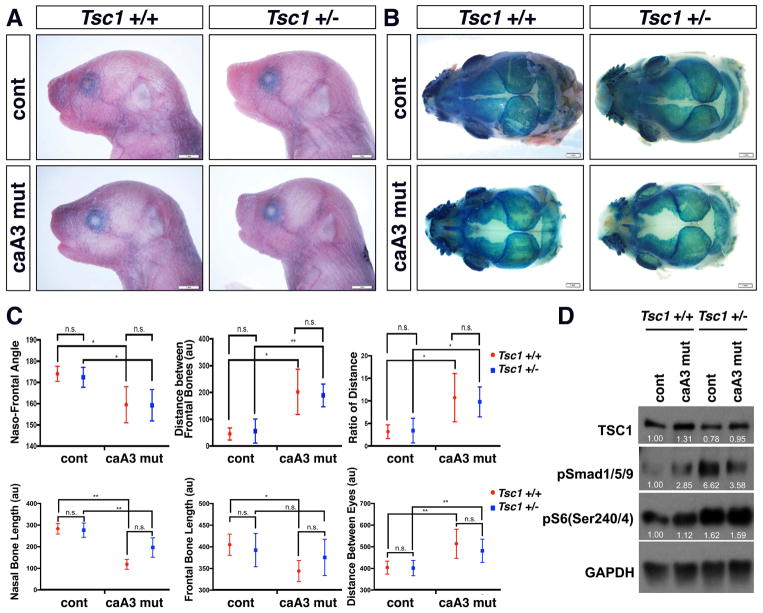
Craniosynostosis is defined as congenital premature fusion of one or more cranial sutures. While the genetic basis for about 30% of cases is known, the causative genes for the diverse presentations of the remainder of cases are unknown. The recently discovered cranial suture stem cell population affords an opportunity to identify early signaling pathways that contribute to craniosynostosis. We previously demonstrated that enhanced BMP signaling in neural crest cells (caA3 mutants) leads to premature cranial suture fusion resulting in midline craniosynostosis. Since enhanced mTOR signaling in neural crest cells leads to craniofacial bone lesions, we investigated the extent to which mTOR signaling is involved in the pathogenesis of BMP-mediated craniosynostosis by affecting the suture stem cell population. Our results demonstrate a loss of suture stem cells in the caA3 mutant mice by the newborn stage. We have found increased activation of mTOR signaling in caA3 mutant mice during embryonic stages, but not at the newborn stage. Our study demonstrated that inhibition of mTOR signaling via rapamycin in a time specific manner partially rescued the loss of the suture stem cell population. This study provides insight into how enhanced BMP signaling regulates suture stem cells via mTOR activation.
Keywords: BMP Smad signaling; craniosynostosis; mTOR; neural crest cells; suture.
© 2018 Wiley Periodicals, Inc.
Conflict of interest statement
All authors state that they have no conflicts of interest.
Figures
Similar articles
-
Augmentation of Smad-dependent BMP signaling in neural crest cells causes craniosynostosis in mice.J Bone Miner Res. 2013 Jun;28(6):1422-33. doi: 10.1002/jbmr.1857. J Bone Miner Res. 2013. PMID: 23281127 Free PMC article.
-
BmpR1A is a major type 1 BMP receptor for BMP-Smad signaling during skull development.Dev Biol. 2017 Sep 1;429(1):260-270. doi: 10.1016/j.ydbio.2017.06.020. Epub 2017 Jun 19. Dev Biol. 2017. PMID: 28641928 Free PMC article.
-
EphA4 as an effector of Twist1 in the guidance of osteogenic precursor cells during calvarial bone growth and in craniosynostosis.Development. 2009 Mar;136(5):855-64. doi: 10.1242/dev.028605. Development. 2009. PMID: 19201948 Free PMC article.
-
The Development of the Calvarial Bones and Sutures and the Pathophysiology of Craniosynostosis.Curr Top Dev Biol. 2015;115:131-56. doi: 10.1016/bs.ctdb.2015.07.004. Epub 2015 Oct 1. Curr Top Dev Biol. 2015. PMID: 26589924 Review.
-
The Bmp pathway in skull vault development.Front Oral Biol. 2008;12:197-208. doi: 10.1159/000115042. Front Oral Biol. 2008. PMID: 18391502 Review.
Cited by
-
Macropore design of tissue engineering scaffolds regulates mesenchymal stem cell differentiation fate.Biomaterials. 2021 May;272:120769. doi: 10.1016/j.biomaterials.2021.120769. Epub 2021 Mar 24. Biomaterials. 2021. PMID: 33798961 Free PMC article.
-
BMP signaling during craniofacial development: new insights into pathological mechanisms leading to craniofacial anomalies.Front Physiol. 2023 May 18;14:1170511. doi: 10.3389/fphys.2023.1170511. eCollection 2023. Front Physiol. 2023. PMID: 37275223 Free PMC article. Review.
-
Augmentation of BMP Signaling in Cranial Neural Crest Cells Leads to Premature Cranial Sutures Fusion through Endochondral Ossification in Mice.JBMR Plus. 2023 Feb 23;7(4):e10716. doi: 10.1002/jbm4.10716. eCollection 2023 Apr. JBMR Plus. 2023. PMID: 37065628 Free PMC article.
-
Signaling Mechanisms Underlying Genetic Pathophysiology of Craniosynostosis.Int J Biol Sci. 2019 Jan 1;15(2):298-311. doi: 10.7150/ijbs.29183. eCollection 2019. Int J Biol Sci. 2019. PMID: 30745822 Free PMC article. Review.
-
Gene regulatory network from cranial neural crest cells to osteoblast differentiation and calvarial bone development.Cell Mol Life Sci. 2022 Feb 27;79(3):158. doi: 10.1007/s00018-022-04208-2. Cell Mol Life Sci. 2022. PMID: 35220463 Free PMC article. Review.
References
-
- Agarwal S, Loder SJ, Brownley C, Eboda O, Peterson JR, Hayano S, … Levi B. BMP signaling mediated by constitutively active Activin type 1 receptor (ACVR1) results in ectopic bone formation localized to distal extremity joints. Dev Biol. 2015;400(2):202–209. doi: 10.1016/j.ydbio.2015.02.011. - DOI - PMC - PubMed
-
- Bai CB, Auerbach W, Lee JS, Stephen D, Joyner AL. Gli2, but not Gli1, is required for initial Shh signaling and ectopic activation of the Shh pathway. Development. 2002;129(20):4753–4761. - PubMed
-
- Briscoe J, Pierani A, Jessell TM, Ericson J. A homeodomain protein code specifies progenitor cell identity and neuronal fate in the ventral neural tube. Cell. 2000;101(4):435–445. - PubMed
Publication types
MeSH terms
Substances
Grants and funding
LinkOut - more resources
Full Text Sources
Other Literature Sources
Molecular Biology Databases
Miscellaneous
