

Akt and mTORC1 signaling as predictive biomarkers for the EGFR antibody nimotuzumab in glioblastoma
- PMID: 30129426
- PMCID: PMC6102828
- DOI: 10.1186/s40478-018-0583-4
Akt and mTORC1 signaling as predictive biomarkers for the EGFR antibody nimotuzumab in glioblastoma
Abstract
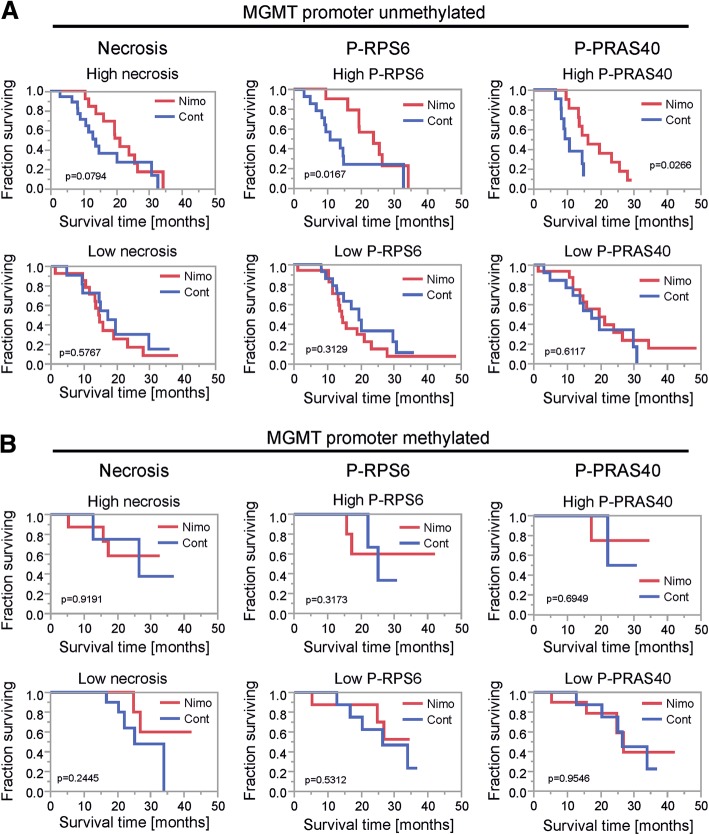
Glioblastoma (GB) is the most frequent primary brain tumor in adults with a dismal prognosis despite aggressive treatment including surgical resection, radiotherapy and chemotherapy with the alkylating agent temozolomide. Thus far, the successful implementation of the concept of targeted therapy where a drug targets a selective alteration in cancer cells was mainly limited to model diseases with identified genetic drivers. One of the most commonly altered oncogenic drivers of GB and therefore plausible therapeutic target is the epidermal growth factor receptor (EGFR). Trials targeting this signaling cascade, however, have been negative, including the phase III OSAG 101-BSA-05 trial. This highlights the need for further patient selection to identify subgroups of GB with true EGFR-dependency. In this retrospective analysis of treatment-naïve samples of the OSAG 101-BSA-05 trial cohort, we identify the EGFR signaling activity markers phosphorylated PRAS40 and phosphorylated ribosomal protein S6 as predictive markers for treatment efficacy of the EGFR-blocking antibody nimotuzumab in MGMT promoter unmethylated GBs. Considering the total trial population irrespective of MGMT status, a clear trend towards a survival benefit from nimotuzumab was already detectable when tumors had above median levels of phosphorylated ribosomal protein S6. These results could constitute a basis for further investigations of nimotuzumab or other EGFR- and downstream signaling inhibitors in selected patient cohorts using the reported criteria as candidate predictive biomarkers.
Keywords: Biomarker; Epidermal growth factor receptor; Glioblastoma; Mammalian target of rapamycin; Nimotuzumab; Targeted therapy.
Conflict of interest statement
Competing interests
MWR, JPS and PNH received a grant to purchase materials necessary for immunohistochemistry from Oncoscience, the pharmaceutical company that owns nimotuzumab. DR is an employee and managing director of Oncoscience.
Publisher’s Note
Springer Nature remains neutral with regard to jurisdictional claims in published maps and institutional affiliations.
Figures


Similar articles
-
Nimotuzumab enhances temozolomide-induced growth suppression of glioma cells expressing mutant EGFR in vivo.Cancer Med. 2016 Mar;5(3):486-99. doi: 10.1002/cam4.614. Epub 2016 Jan 18. Cancer Med. 2016. PMID: 26778701 Free PMC article.
-
A randomised, open label phase III trial with nimotuzumab, an anti-epidermal growth factor receptor monoclonal antibody in the treatment of newly diagnosed adult glioblastoma.Eur J Cancer. 2015 Mar;51(4):522-532. doi: 10.1016/j.ejca.2014.12.019. Epub 2015 Jan 20. Eur J Cancer. 2015. PMID: 25616647 Clinical Trial.
-
The combined EGFR protein expression analysis refines the prognostic value of the MGMT promoter methylation status in glioblastoma.Clin Neurol Neurosurg. 2016 Oct;149:15-21. doi: 10.1016/j.clineuro.2016.07.023. Epub 2016 Jul 18. Clin Neurol Neurosurg. 2016. PMID: 27450763
-
Discrete signaling mechanisms of mTORC1 and mTORC2: Connected yet apart in cellular and molecular aspects.Adv Biol Regul. 2017 May;64:39-48. doi: 10.1016/j.jbior.2016.12.001. Epub 2017 Jan 4. Adv Biol Regul. 2017. PMID: 28189457 Review.
-
Pathology: commonly monitored glioblastoma markers: EFGR, EGFRvIII, PTEN, and MGMT.Neurosurg Clin N Am. 2012 Apr;23(2):237-46, viii. doi: 10.1016/j.nec.2012.01.011. Epub 2012 Feb 22. Neurosurg Clin N Am. 2012. PMID: 22440867 Review.
Cited by
-
Radiomics for pseudoprogression prediction in high grade gliomas: added value of MR contrast agent.Heliyon. 2022 Aug 2;8(8):e10023. doi: 10.1016/j.heliyon.2022.e10023. eCollection 2022 Aug. Heliyon. 2022. PMID: 35965975 Free PMC article.
-
Autophagy induced by Schwann cell-derived exosomes promotes recovery after spinal cord injury in rats.Biotechnol Lett. 2022 Jan;44(1):129-142. doi: 10.1007/s10529-021-03198-8. Epub 2021 Nov 5. Biotechnol Lett. 2022. PMID: 34738222 Free PMC article.
-
Signaling pathways in brain tumors and therapeutic interventions.Signal Transduct Target Ther. 2023 Jan 4;8(1):8. doi: 10.1038/s41392-022-01260-z. Signal Transduct Target Ther. 2023. PMID: 36596785 Free PMC article. Review.
-
Unconventional Protein Secretion in Brain Tumors Biology: Enlightening the Mechanisms for Tumor Survival and Progression.Front Cell Dev Biol. 2022 Jun 15;10:907423. doi: 10.3389/fcell.2022.907423. eCollection 2022. Front Cell Dev Biol. 2022. PMID: 35784465 Free PMC article. Review.
-
EGFR and mTOR as therapeutic targets in glioblastoma.Oncotarget. 2019 Jul 30;10(46):4721-4723. doi: 10.18632/oncotarget.27094. eCollection 2019 Jul 30. Oncotarget. 2019. PMID: 31413813 Free PMC article. No abstract available.
References
Publication types
MeSH terms
Substances
LinkOut - more resources
Full Text Sources
Other Literature Sources
Medical
Research Materials
Miscellaneous
